Rania Hassen, Zhou Wang , and Magdy Salama
Sharpness is an important determinant in visual assessment of image quality. The human visual system is able to effortlessly detect blur and evaluate sharpness of visual images, but it still yet a challenging task for computers. Existing blur/sharpness evaluation algorithms are mostly based on edge width, local gradient, or energy reduction of global/local high frequency content. In this work, a no-reference sharpness assessment algorithm is developed based on the identification of sharpness from a different perspective as strong local phase coherence (LPC) near distinctive image features evaluated in the complex wavelet transform domain. Detailed description is given in the following paper:
- R. Hassen, Z. Wang, M. Salama, "Image Sharpness
Assessment Based on Local Phase Coherence", IEEE Transactions on
Image Processing, vol. 22, no. 7, pp. 2798-2810, July 2013..
- R. Hassen, Z. Wang, M. Salama, "No-Reference Image
Sharpness Assessment Based On Local Phase Coherence Measurement",
IEEE International Conference on Acoustics, Speech, and Signal Processing
(ICASSP'11), Dallas, Texas, U.S.A, March 15-19, 2010.
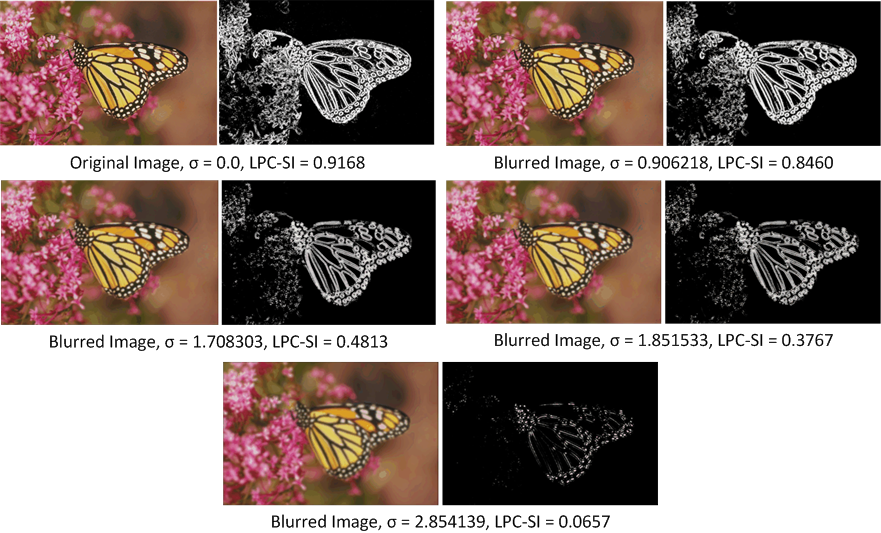
In the following, we show an exmaple of a natural image and its corresponding LPC map. The image has been blurred using Gaussian blur filter with various sigma values. LPC-SI gives a very good estimation of sharpness quality of a given image.
LPC-SI performance is evaluated using four blur data sets obtained from four independent subject-rated publicly available image databases including LIVE database, TID2008 database, CSIQ database, and IVC database. Table 1 summarizes the performance comparison results based on all four databases aganist some selected recent and state-of-the-art quality assessmnet algorithms. More comparison results can be found in TIP paper. LPC-SI measure performs reasonably well and consistently over all four databases and in general are among the most competitive NR methods. Figure 1 shows LPC-SI scatter plot of subjective versus objective quality scores after nonlinear mapping for the four databases, where each sample point represents one test image. LPC-SI method generally gives reasonable quality predictions, where the sample points tend to be clustered closer to the diagonal lines which represents perfect prediction.
|
Table 1: Performance
Evaluation Over Four Databases. |
||||||||||||
|
LPC-SI |
S3 |
JNBM |
CPBD |
SSIM |
PSNR |
|||||||
|
Database |
SRCC |
KRCC |
SRCC |
KRCC |
SRCC |
KRCC |
SRCC |
KRCC |
SRCC |
KRCC |
SRCC |
KRCC |
|
LIVE |
0.9501 |
0.7994 |
0.9517 |
0.8157 |
0.7821 |
0.6015 |
0.9271 |
0.7714 |
0.9990
|
0.9780 |
0.8694
|
0.6920 |
|
TID2008 |
0.8431
|
0.6249 |
0.8418
|
0.6124 |
0.6681
|
0.4947 |
0.8418 |
0.6297 |
0.9550
|
0.8147 |
0.8702
|
0.7327 |
|
CSIQ |
0.8931 |
0.7022 |
0.9058 |
0.7290 |
0.7624
|
0.5971 |
0.8790
|
0.6905 |
0.9605 |
0.8246 |
0.9287 |
0.7539 |
|
IVC |
0.9202
|
0.7831 |
0.8691
|
0.7090 |
0.6737
|
0.4947 |
0.7744
|
0.6105 |
0.9353
|
0.7789 |
0.8105 |
0.6632 |
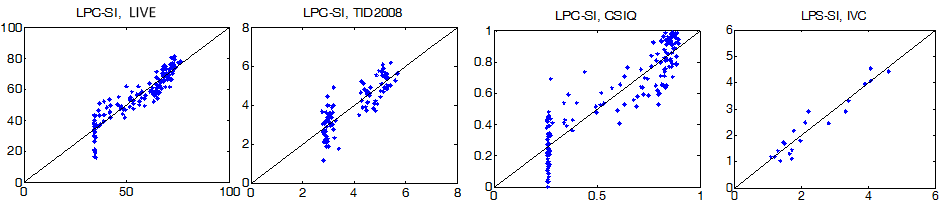
Figure 1: LPC-SI Scatter plots between subjective and objective scores
over four blur image databases.
Images from the LIVE database distorted with Gaussian blur of standard deviation in the range between 0 and 4 have been utilized in this experiment. The sharpness indices of eight algorithms, namely JNBM, CPBD, H-metric, Q-metric, BLIINDS2, BRISQUE, S3 and LPC, are computed. Figure 2 shows the relationship between the sharpness metrics and the standard deviation. It is clear that all eight algorithms have a monotonic behavior and therefore can successfully rank-order the same image with different blur parameters. On the other hand, the sharpness measures behave differently when blurred images generated from different source images are compared. It is worth noting that the goal of a perceptual sharpness measure is to predict the perceived blur, but not the numerical factor used to create the blurred image. The perceptual blur and the numerical blur may not perfectly agree with each other, especially when the images are signiffcantly different in texture content and complexity. An example is given in Figure 3, where Image 1 is created by higher numerical blur but has higher MOS as well. This suggests that it is not a good idea for an objective sharpness measure to estimate the numerical blur parameter and use that to predict perceived sharpness.
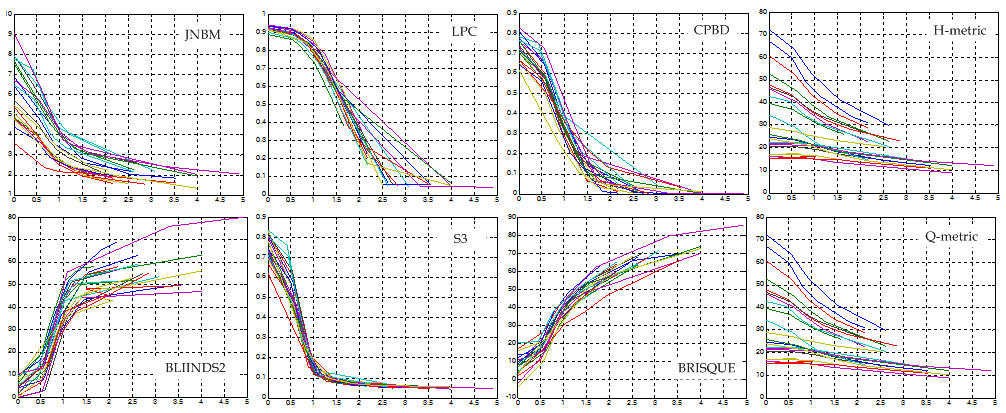 Figure 2: Relationship
between the standard deviations of Gaussian blur and state-of-the-art sharpness
measure.
Figure 2: Relationship
between the standard deviations of Gaussian blur and state-of-the-art sharpness
measure.
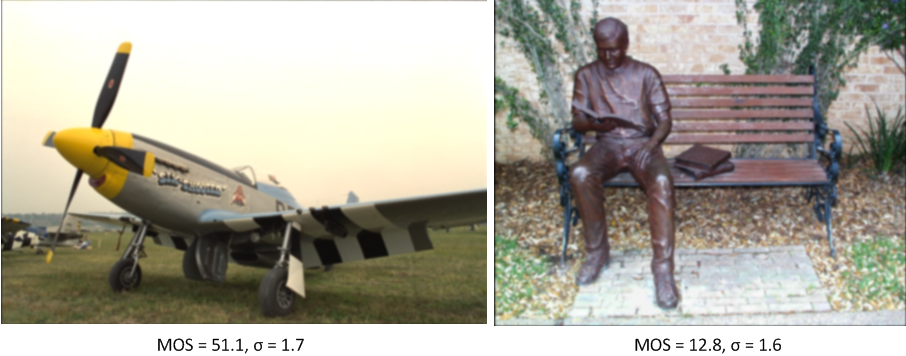
Figure 3: Conflict between numerical blur factor and perceived image
quality. The left image is created by higher standard deviation value . of Gaussian blur, but has
much higher mean opinion score (MOS) than the right image. For better
visualization, the images need to be enlarged, and the right image often causes
strong discomfort of human observers.
One useful feature of the proposed LPC-SI approach is that it provides a LPC map that indicates the spatial variations of local sharpness. Sample images are given in Figure 4, together with their corresponding sharpness maps produced by CPBD, H-Metric, S3, and LPC-SI algorithms. Unlike the other algorithms, LPC-SI does not employ block-based computation, and produces the most localized sharpness map. Visual comparisons of the sample images together with the sharpness maps in Figure 4 suggest that all four types of sharpness maps convey useful information regarding local sharpness variations, and the H-Metric, S3 and LPC-SI, to a significant extent, agree with each other, though the localization of the measurement could be very different. It is worth mentioning that these sharpness maps are computed to compare the local behavior of the competing algorithms only, some of which may not be designed to generate accurate local sharpness measurement but to predict the overall human sharpness assessment of the whole image. Moreover, without precise local sharpness assessment by human subjects (which will be our future work), it is difficult to conclude about the relative performance of these maps.
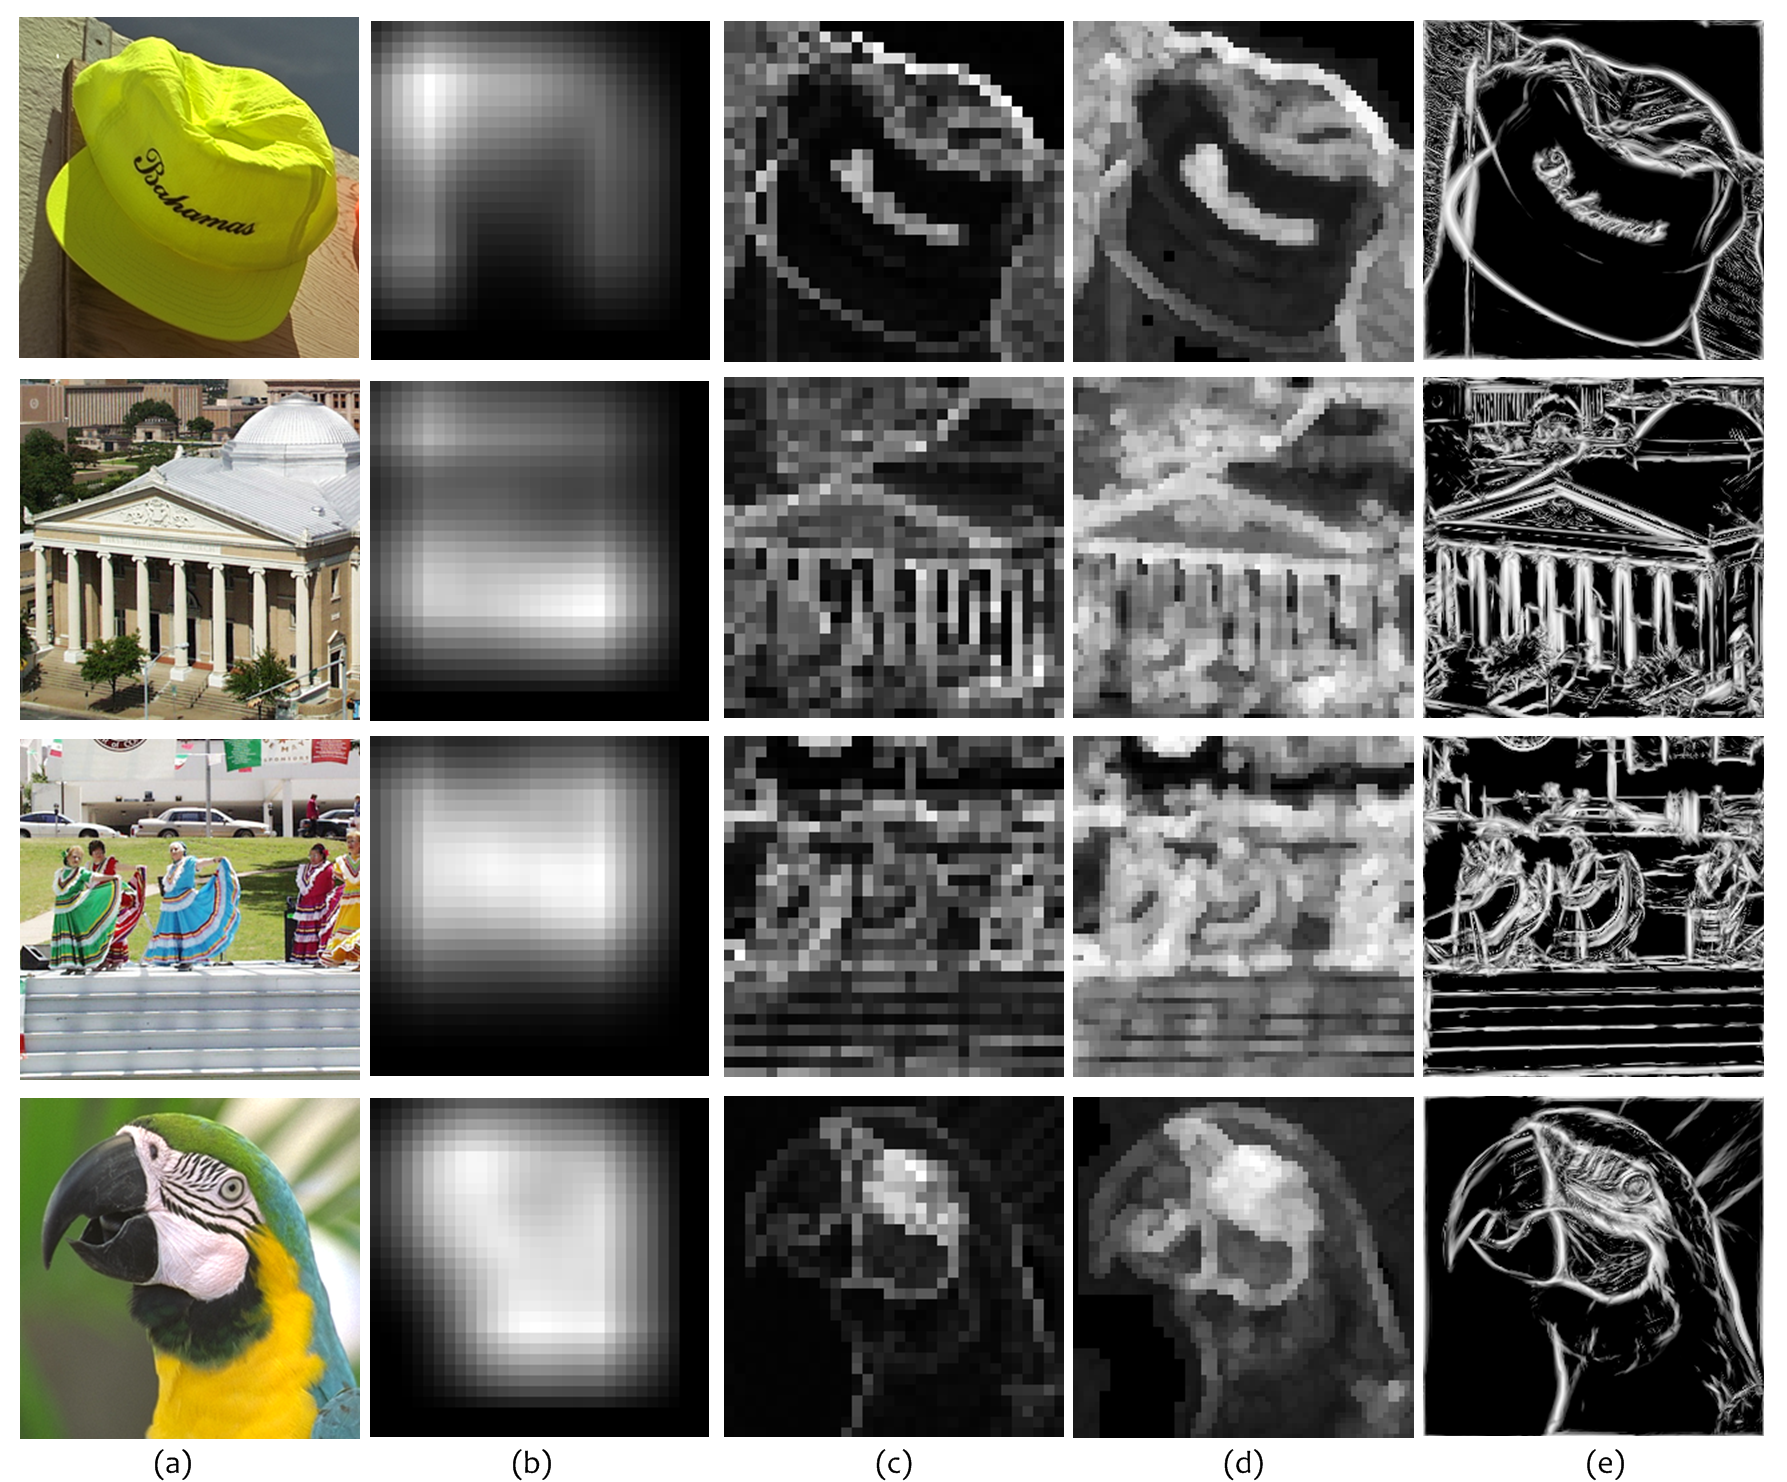
Figure 4: (a) Sample images and their corresponding (b) CPBD, (c)
H-metric, (d) S3, and (e) LPC-SI sharpness maps, where brighter indicates
higher sharpness.
Download
A Matlab implementation of the LPC-SI is available here. You can download
and use it for research work, but please cite the above papers.download LPC-SI