|
The SSIMplus Index for Video
Quality-of-Experience Assessment |
|
|
The SSIMplus Index
SSIMplus is an objective full-reference
perceptual video quality-of-experience (QoE) index
ranges between 0 and 100. SSIMplus in many ways goes
far beyond what SSIM
can do. Its distinctive features include:
-
High
accuracy
-
High
speed
-
Straightforward
and easy-to-use
-
Device-adaptive
QoE assessment
-
Cross-resolution
QoE assessment
-
Cross-content
QoE measurement
-
Detailed quality map
SSIMplus was developed by the team of Prof. Zhou Wang in Waterloo, Ontario, Canada. Details can be found in the following papers:
1.
A. Rehman,
K. Zeng and Z.
Wang, "Display device-adapted video
quality-of-experience assessment," IS&T-SPIE Electronic Imaging, Human Vision and Electronic
Imaging XX, Feb. 2015.
More details and results will also be presented in
future publications/talks. Please be advised from the publication page of
Prof. Wang.
Applications of SSIMplus
SSIMplus may be employed in many application scenarios. In the field of video
delivery over multimedia communication networks, SSIMplus
may be applied in the following ways:
-
Live and file-based video QoE monitoring
-
Benchmarking video encoders and
transcoders
-
Guiding adaptive bit-rate video
coding
-
Enabling smart quality-driven
adaptive bit-rate video streaming
SSIMplus Features
SSIMplus not only employs advanced computational models derived from vision science
and state-of-the-art visual quality assessment research, but is also optimized
for speed and designed for providing meaningful quality scores comparable
across device, resolution and content. The SSIMplus
features are briefly explained as follows.
High Accuracy
SSIMplus has been tested using many video
quality databases and exhibits high prediction accuracy of perceived video
quality by humans. Results of a recent test performed at University of Waterloo are given here:
A set of raw videos
sequences, consisting of 1080p and 640p resolutions, was compressed at various
distortion levels to produce H.264-compliant bitstreams.
The decompressed test videos were rated by subjects under the following viewing
conditions:
-
Display
Device: iPhone 5S, viewing distance: 10 inches
-
Display
Device: iPad Air, viewing distance: 16 inches
-
Display
Device: Lenovo W530 laptop, viewing distance: 20 inches
-
Display
Device: Sony 55"
TV, viewing distance: 90 inches
-
Display
Device: Sony 55"
TV, viewing distance: 20 inches (referred to as TV-Expert)
This database is one of the
first of its kind for cross-device video quality assessment. The mean opinion
score (MOS) of human subjects for each video viewed at each condition is computed
and used as the ground-truth to test the performance of SSIMplus
and other objective video quality models. The scatter plots of MOS versus
popular models (PSNR, SSIM, MS-SSIM, MOVIE and VQM)
are given in Figure 1.
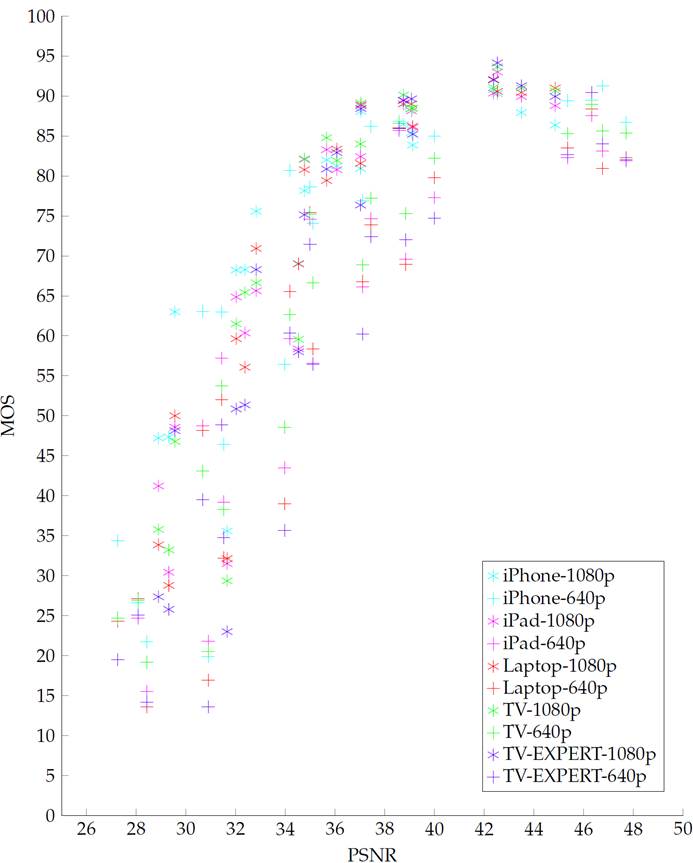
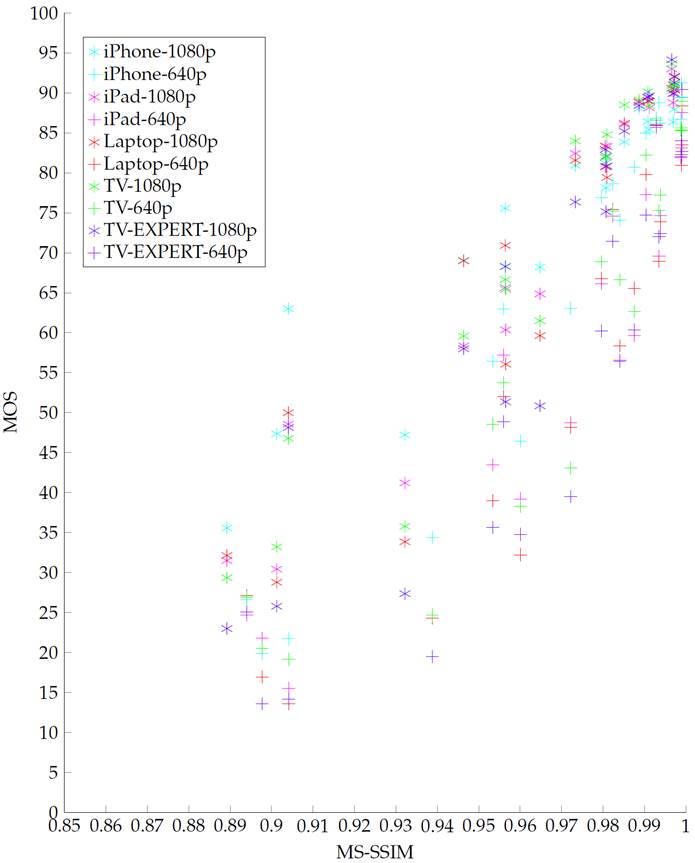
Figure 1. Scatter plots of MOS
versus various video quality models, including PSNR, SSIM, MS-SSIM, VQM, MOVIE
and SSIMplus.
The superior performance of SSIMplus is evident from Figure 1, and is
also confirmed by numerical evaluations using Pearson linear correlation
coefficient (PLCC), mean absolute prediction error (MAE), root mean squared
prediction error (RMS), Spearman rank-order correlation coefficient (SRCC) and
Kendall rank-order correlation coefficient (KRCC). A better model should have
higher PLCC, SRCC and KRCC, and lower MAE and RMS values. The results are
summarized in Table 1.
Table 1. Performance comparison of state-of-the-art video quality models
|
Model |
PLCC |
MAE |
RMS |
SRCC |
KRCC |
Computation Time (normalized based on PSNR) |
|
PSNR |
0.9062 |
7.4351 |
9.8191 |
0.8804 |
0.6886 |
1 |
|
SSIM |
0.9253 |
6.9203 |
8.8069 |
0.9014 |
0.7246 |
22.65 |
|
MS-SSIM |
0.8945 |
8.1969 |
10.384 |
0.8619 |
0.6605 |
48.49 |
|
VQM |
0.8981 |
8.0671 |
10.214 |
0.8703 |
0.6711 |
174.53 |
|
MOVIE |
0.9096 |
7.4761 |
9.6493 |
0.8892 |
0.7001 |
3340.27 |
|
SSIMplus |
0.9732 |
4.3192 |
5.3451 |
0.9349 |
0.7888 |
7.83 |
High Speed
Video QoE measurement is often a
computationally demanding task but real-world applications such as live QoE monitoring often desire videos being evaluated in
real-time. The SSIMplus method has been optimized for
speed. The last column of Table 1 compares SSIMplus
with state-of-the-art video quality assessment models, where it can be observed
that the computational cost of SSIMplus, the most
accurate model in predicting visual QoE, is only 7.83
times of PSNR, far less than the other popular models. The low computational
cost allows SSIMplus to be computed faster than
real-time, even when comparing ultra-HD 4K video.
Straightforward and Easy-To-Use
SSIMplus provides straightforward predictions
on what an average human viewer would say about the quality of the video being
viewed on a scale of 0-100, which is evenly divided to five quality ranges of
bad (0-19), poor (20-39), fair (40-59), good (60-79), and excellent (80-100),
respectively. An example is shown in Figure 2. SSIMplus
can be easily embedded into real-world systems for various applications such as
live or file-based QoE monitoring, benchmarking of
video encoders/transcoders, guiding adaptive bit-rate video encoding, and smart
adaptive bitrate streaming.
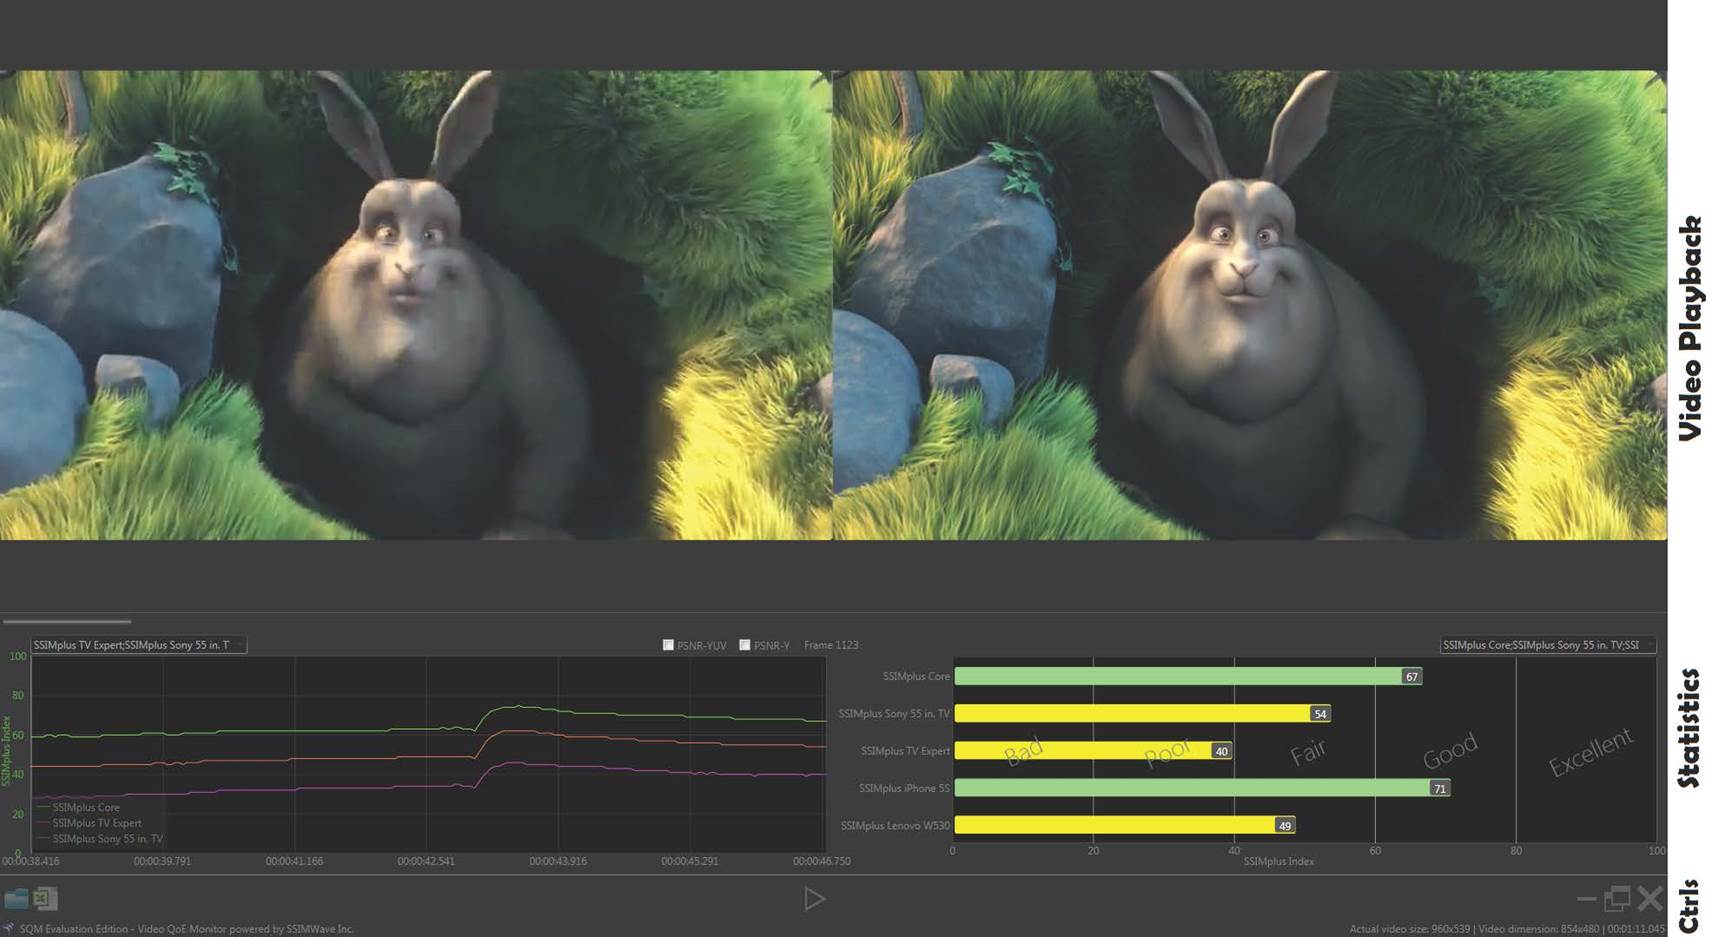
Figure 2. SSIMplus assessment of video QoE. Top-left: test video; Top-right: reference video;
Bottom-left: QoE curves over time; Bottom-right:
running bars of device-adaptive QoE assessment.
Device-Adaptive QoE
Assessment
The same video stream delivered to different display devices
(cellphones, tablets, laptops, desktop monitors, TVs, etc)
at different viewing conditions could result in drastically different visual QoE. Traditional video quality assessment approaches such as
PSNR, SSIM, VQM and MOVIE, are unable to adapt to devices. The advanced
modeling underlying SSIMplus allows it to be easily
adapted to different viewing devices and conditions, and provides meaningful quality scores comparable across
devices. An example is given in Figure 2, where the same video viewed on
different devices are predicted to have very different QoE
scores. The superior cross-device performance is evidenced by Figure 1 and
Table 1, where videos viewed on different devices are mixed together. This is a
critical feature for video content providers and distribution service providers
to predict what each user in the network is experiencing, and also allows for smart adaptive bit-rate video streaming.
Cross-Resolution QoE
Assessment
The spatial resolution of a video signal is often altered before, during
and after delivery to fit bandwidth, power, buffering
and display constraints. In the case of adaptive bit-rate streaming, video is
typically transcoded into many versions with different spatial resolutions. SSIMplus allows for assessing the quality of a test video
when the reference video has a different spatial resolution, and provides meaningful quality scores comparable across
resolutions. This is another distinctive feature missing from existing
video quality assessment approaches. The feature is partially demonstrated
through the cross-resolution results shown in Figure 1.
Cross-Content QoE Assessment
One of the most challenging task in the development of video quality
models is to supply meaningful quality
scores comparable across content. Traditional video quality models such as
PSNR often exhibits satisfying monotonicity when tested on the same video
content compressed by the same codec, but fail miserably when videos of
different content and with distortion types are mixed together. SSIMplus demonstrates the strongest robustness to
variations of video content and compression techniques, so that the same score
has the same meaning, regardless of the type of video content (news, natural
scenes, sports, and animations, etc), codecs (MPEG2,
H.264, HEVC, VPx) and other distortion types (noise,
blur, and unknown types).
Detailed Quality Map
For users who are interested in deep analysis of video quality and
diagnosis of video defects, SSIMplus delivers
localized quality predictions deep to per-pixel granularity by producing a
quality map that predicts the quality at every pixel in every frame in the test
video. Using the quality maps, users can inspect quality defects of a video at
each spatial location of each video frame, allowing for precise and in-depth
evaluation, comparison, design, and optimization of their video compression,
processing, storage, reproduction, delivery, and display systems.
Requests for SSIMplus
Interested users can request the SSIMplus
video quality-of-experience monitoring software from the link below:
SSIMplus
Quality-of-Experience Monitor (SQM)
Created
November 9, 2014
Last
updated November 9, 2014