Project 5
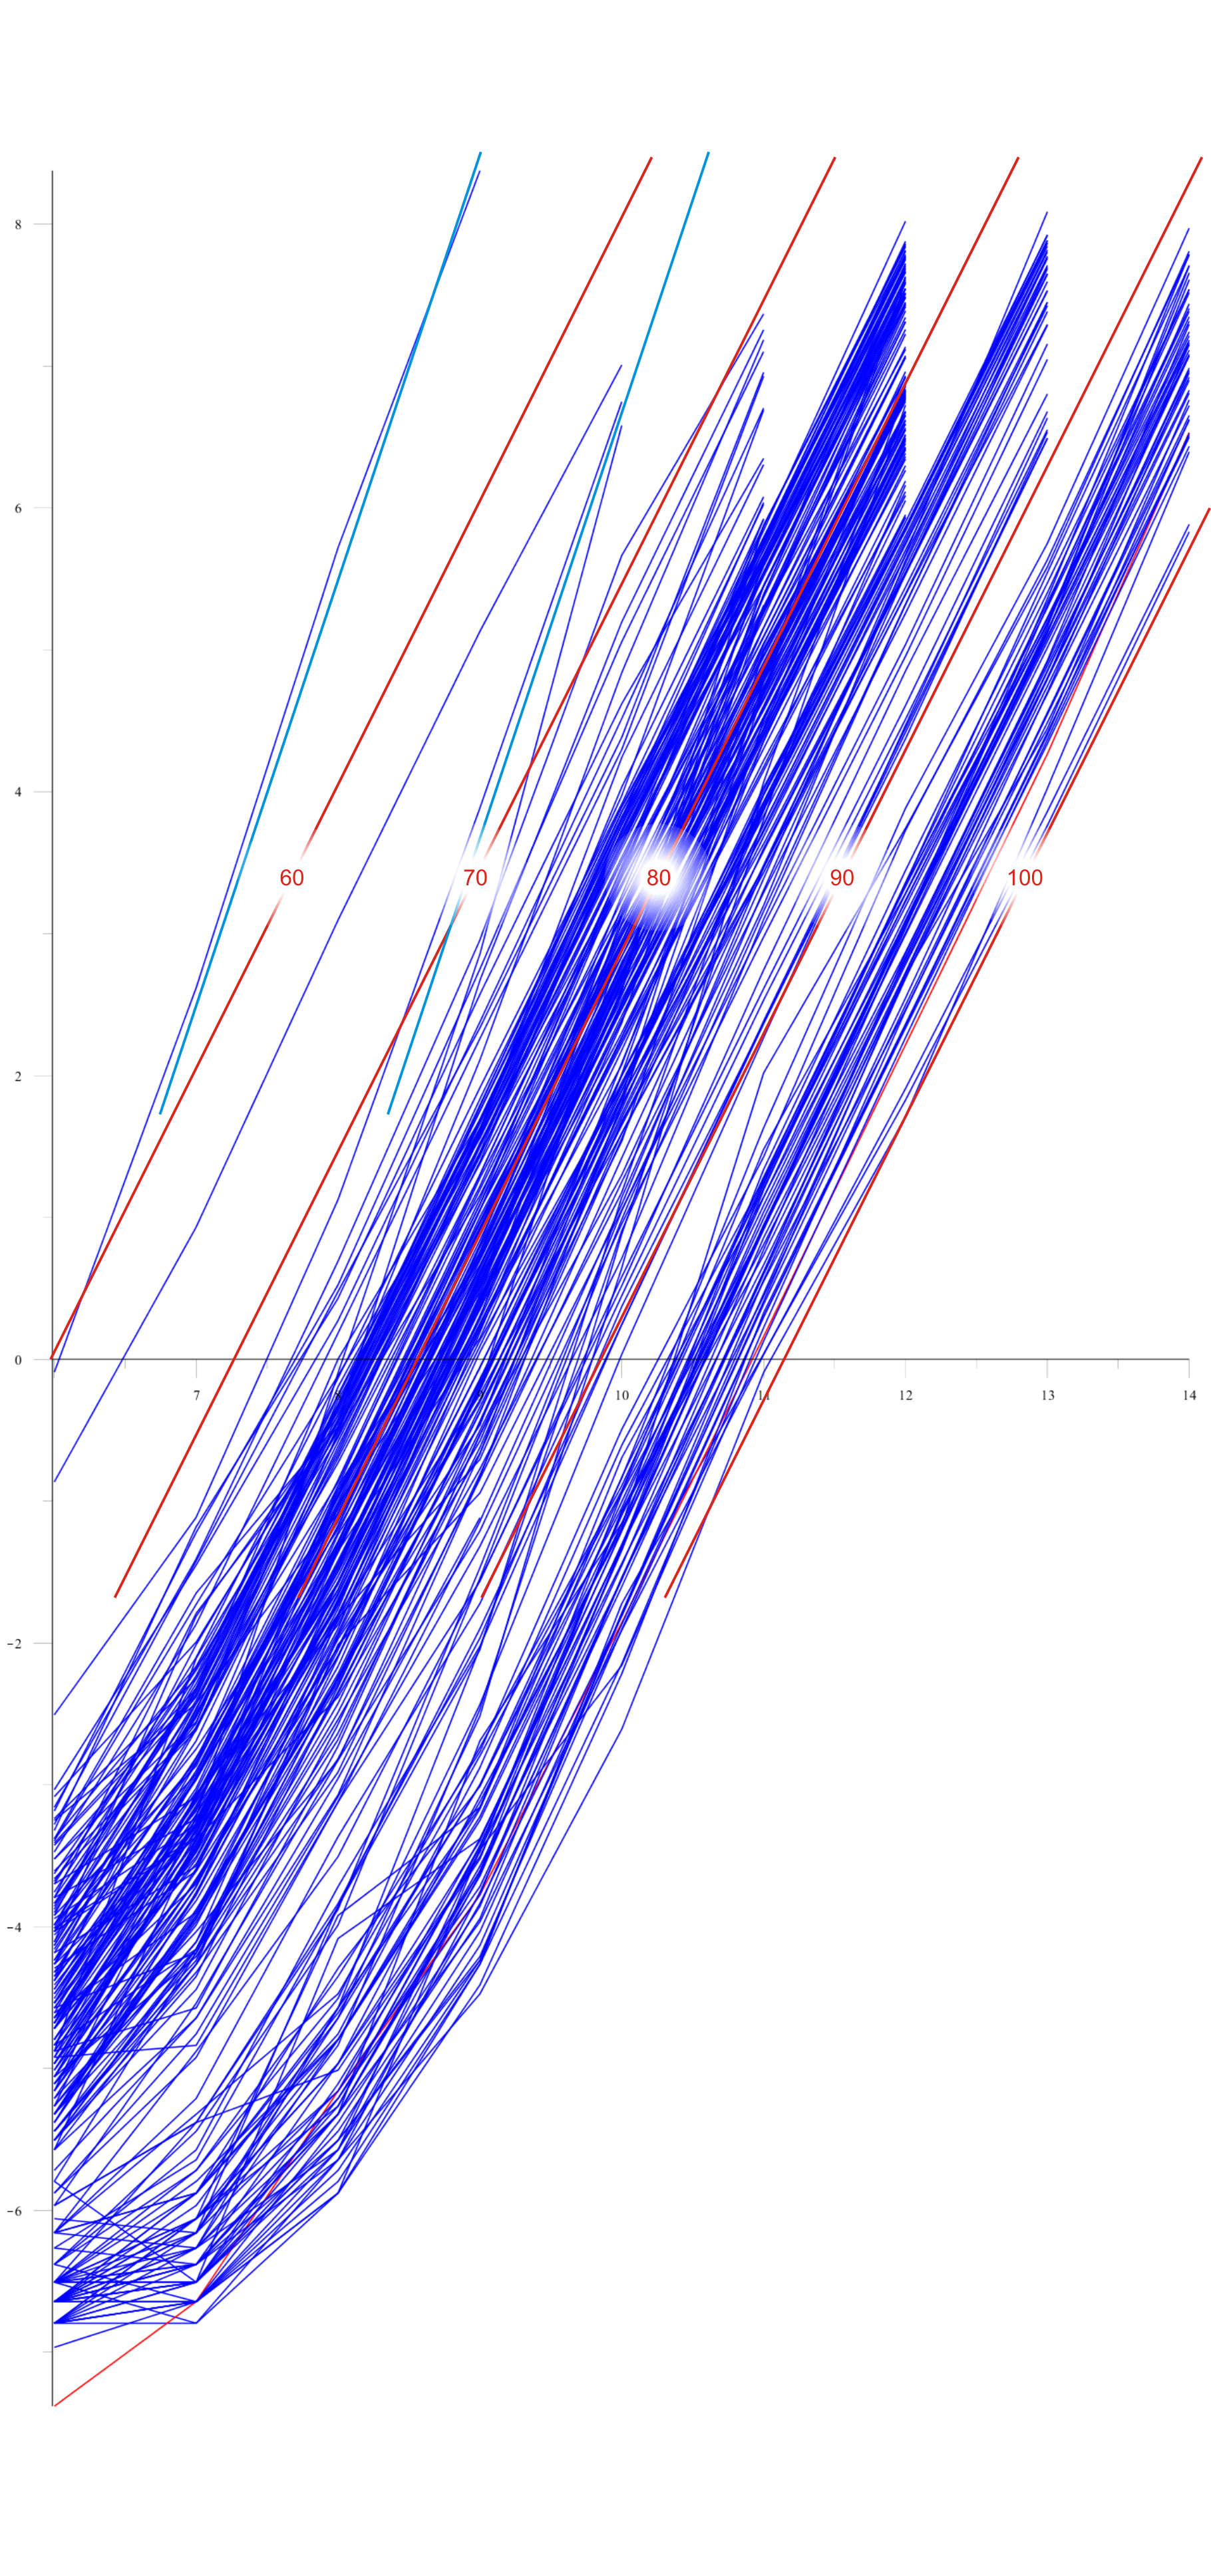
The graph of all students times is here. The grades are displayed using red bars. It is a lg-lg plot, and thus you will see that most of the slopes are two; however, three students appear to implemented the algorithm so that the sample code runs in cubic time.
Congratulations to the nine individuals who beat my previously recorded times. These include:
c444wang*, gndaryee, cxlei, enruizno, kkung, mbadefop*, etakefma
Some came very close to matching my times, and these include:
eacolina, mhgill*, j74kang
Those marked with a star (*) used data structures in the Standard Template Library.
To be fair, I ran the code for the last three students multiple times, and while usually mine beat theirs, on occasion, their best times did better than my worst times. Thus, all those above who did not use the STL can come and collect their $20, including those who are very close to my times.
Also, to be fair, I used the times I originally sent out; again, there is variation depending on load, etc.
The formula that converts your performance to a grade is:
Suppose speed2.out $N$ ran in $t$ seconds on ecetesla0. You can then can calculate your grade as follows:
${\rm round}\left( 7.5 \left( N - \log_2( t )/2 \right ) \right ) + 16.9$.
You can view your score here (with one extra decimal point, to allow for comparisons). If you got below 75 or your code did not make the cut for testing (errors or incorrectly implemented algorithms) your score is not visible. Note, technically, this formula only technically works for algorithms running the speed test in qudratic time.
Requirements:
In this project, you will implement one class implementing the algorithm:
A skeleton header file for this class and its associated class is provided. You may modify these files for the project, though you must add your own comments. Do not copy text from the specifications. Testing tools for some of the classes provided in the associated testing directory.
You are required to submit within your gzipped tar file the following header file(s):
- Weighted_graph.h
You may add any other header files (of your own authorship) you need for your project to work.
Be sure to read the instructions on the Projects page with regard to the submission of projects.
You may use all standard libraries available on ecelinux. This includes the Standard Template Library (STL), cstring, etc.
Runtime
Forty percent of the grade will be attributed to run-time relative to other students in your class. The class average and standard deviation will be calculated (with outliers removed), and those achieving the class average will get 80 %. Other grades will be based on 10 marks per standard deviation in either direction.
Memory usage
There are no constraints on memory use in this project.
Prizes
There will also be prizes for at least the the top three students: dinner at AM Africa together with the course staff. Also, if either of these winners in the first category or the teaching assistants have code faster than the instructor's implementation, those individuals will awarded $20.
Comments
You are expected to comment your code. At least 20% of your source code must be in the form of valid and informative comments. As you will use this class in future projects, it is advisable to comment it appropriately. You are also expected to comment the provided bare header files.
Testing
One test file is provided, however, it is by no means a complete.
Testing Strategies
As before, write all the stubs and then implement the functions one at a time. Consider boundary cases.
Check List
Have you:
- Have you named the file correctly? (uwuserid_p5.tar.gz where uwuserid is your UW User ID.)
- Are you submitting a gzipped tar file? (Not a rar nor a zip.)
- Is the gzipped file not corrupt?
- Does your submission contain the file(s) mentioned above?

Department of Electrical and Computer Engineering
University of Waterloo
200 University Avenue West
Waterloo, Ontario, Canada N2L 3G1
Website maintained by Douglas Wilhelm Harder