For a PDF version of this document, please see Cortex_debugger.pdf.
Introduction
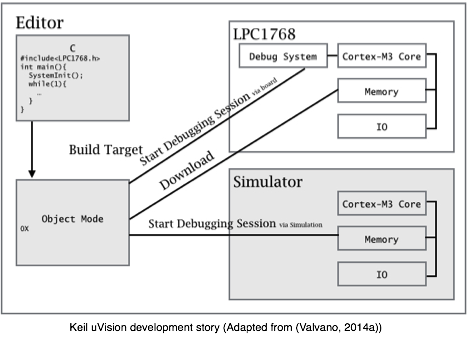
uVision has powerful tools for debugging and developing C and Assembly code. For debugging a code, one can either simulate it on the IDE’s simulator or execute the code directly on a Keil board. As the following figure shows, uVision can simulates a microcontroller architecture and execute all instructions just like the real one. uVision also can communicate with the debugging chip through interfaces like JTAG or Cortex debug.
The hardware simulator shipped with uVision is a powerful simulator that you can emulate the code on almost every Cortex/Arm chips and their peripherals. The code can be tested and debugged without even using the actual hardware environment such as MC1700 Keil board. The simulator provides a precise clock sequence which can be trusted like the actual hardware. However, the clock runs much slower compared the real environment. On other hand, the uVision connects to debugging ports via JTag or Cortex debug 10/20 pins and provides all on the fly debugging facilities such as break points, watch points, register/memory monitoring, and peripheral emulator. One of the USB wires, usually the black one, that connects the Keil port to PC is for flashing and debugging.
The hardware simulator shipped with uVision is a powerful simulator that you can emulate the code on almost every Cortex/Arm chips and their peripherals. The code can be tested and debugged without even using the actual hardware environment such as MC1700 Keil board. The simulator provides a precise clock sequence which can be trusted like the actual hardware. However, the clock runs much slower compared the real environment. On other hand, the uVision connects to debugging ports via JTag or Cortex debug 10/20 pins and provides all on the fly debugging facilities such as break points, watch points, register/memory monitoring, and peripheral emulator. One of the USB wires, usually the black one, that connects the Keil port to PC is for flashing and debugging.
How to setup the debugger
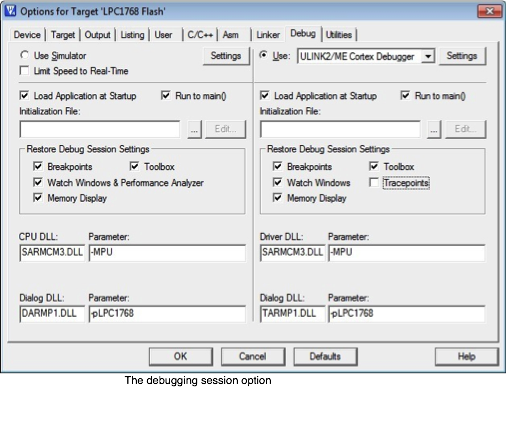
The uVision debugger can be configured to Simulator or Target debugger. To choose one, select Debug tab from Options for Target (Project->Options for Target ... ) when the developing mode is active. As depicted in the following figure, many options can be set for either modes. To debug the target flashed program, click on the Use radio button and pick ULINK2/ME Cortex Debugger option.
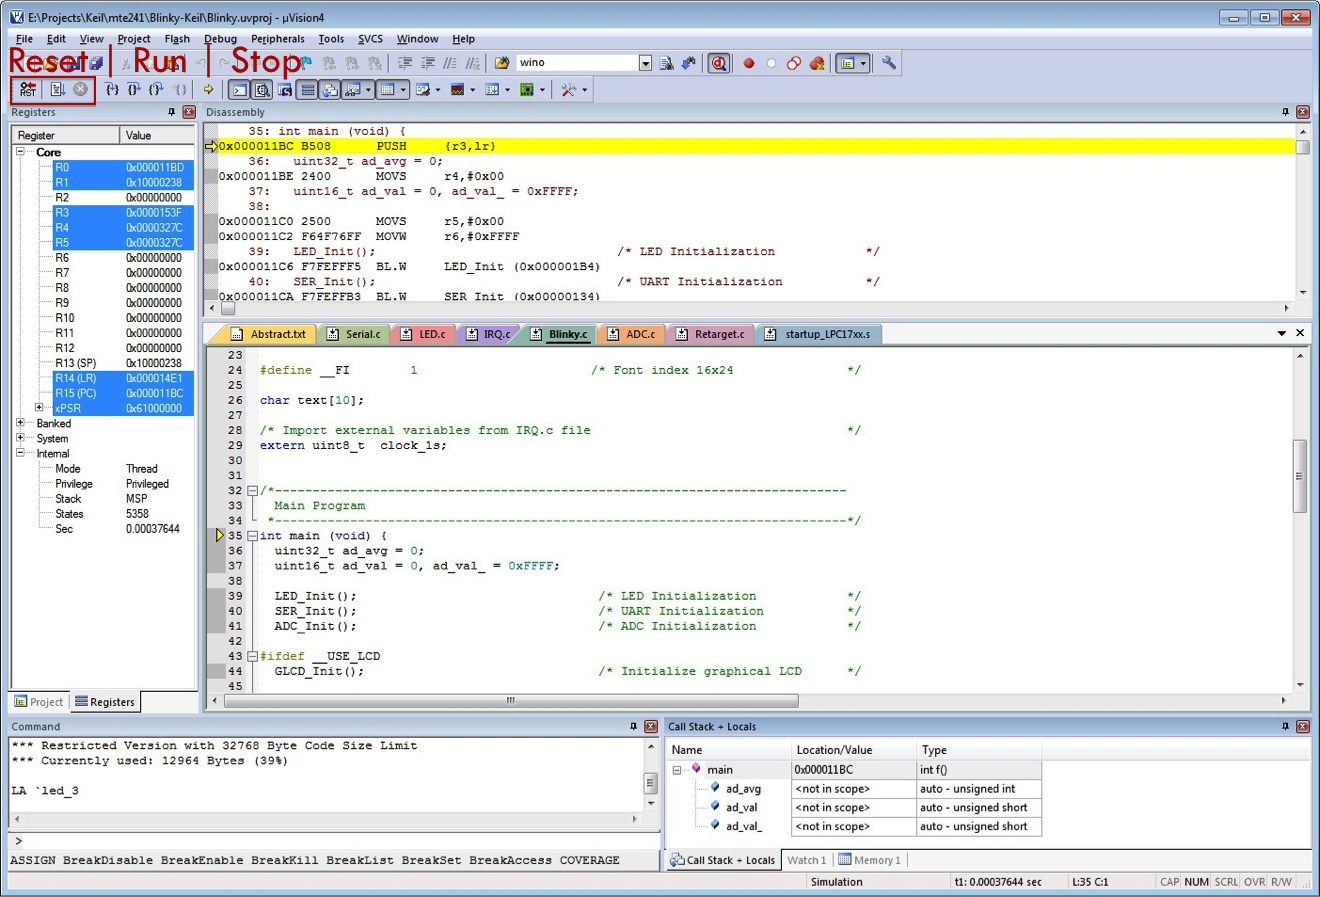
Once the code is successfully built, the debugging mode is started by clicking on its icon. As, the following figure shows, many futures become accessible in the debugging mode. Such features are enabled or disabled with Debug menu. By default, you can see the Registers’ content, Disassembly code, Call stack, and Variable content. To perform a debugging session, you may run it, stop it, or reset it.
The uVision has many useful features for debugging CMSIS and RTX based codes(Keil.com. (n.d.)):
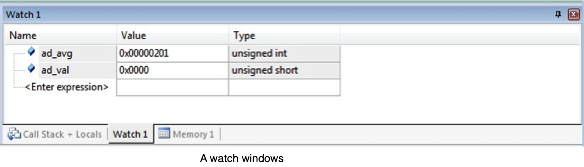
Watch window
Using the watch window, one can see the content of any variable at any time. To watch a variable content, you may select the variable, right click on the selected name, and choose add to watch1. The content of the variable becomes visible whenever the variable is alive in the current trace.
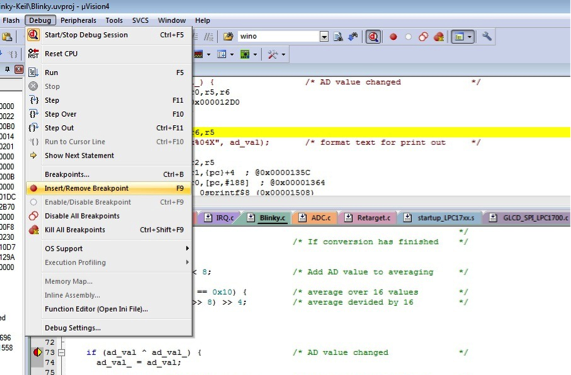
Hardware Breakpoints
During a debugging session, one usually wants to break the current execution and check the variables’ content at a particular point (Keil.com. (n.d.)). Breakpoints are very useful feature in all debugging tools and IDEs such as Eclipse, Visual Studio, and GDB. uVision supports execution, read/write access, and complex breakpoint. An execution breakpoint can be places at any executable line of Assembly or C code. To place a breakpoint find the line you want to stop on, just go to Debug menu and select Insert/Remove Breakpoint. A red circle on the left side of the intended code shows the breakpoint is successfully placed and the execution is stopped while the program counter is passing by. Breakpoints can be disabled or removed via Debug menu.
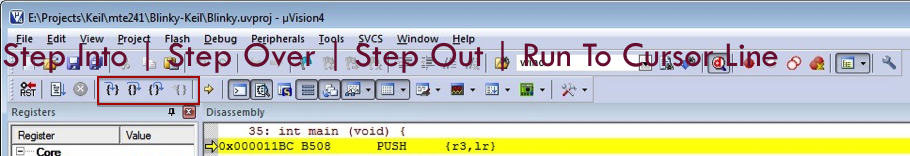
Once an execution is paused on an statement, the processing unit stopped and the program counter does not proceed to the next statement, so one can see the call stack content, registers’ values, watched variables, and port values. Like any other debugger, one can Step Into statement, Step Over the next statement, Step Out from the next statement, or Run To Cursor Line . The execution trace can also be continued using Run command, or to be terminated using Stop command.
Viewing Memory Contents
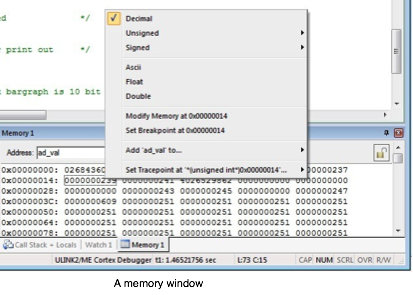
From the Debug Toolbar or View menu, one can activate the Memory window showing the memory content at each memory address. The memory content could be shown in Hex or Dec. Given an address location, the memory window shows the byte or words around with respect to what data format is asked. As shown in the following figure, by right clicking in memory window one can select her intended format.
Using Peripheral Windows
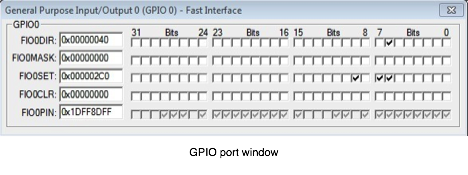
Using the uVision debugger, one can monitor and change the memory locations regarding each peripheral in its Window. The Peripherals menu provides a separate access to I/O and serial ports, A/D convertors, interrupts, times and chip specific peripherals (Keil.com. (n.d.)). The following figure representing the General Purpose Input/Output 0 (GPIO 0) window shows the value of each memory location related to general purpose I/O ports.
Debugging Procedure
So far we have seen many debugging tools that uVision provides, but how can we use them and why do we basically them? To answer these types of questions, first we need to see what is debugging. Practitioners and researchers do not agree on a unique definition about debugging. Many terms, such as program testing, diagnosis, tracing, or profiling, are interchangeably interpreted as debugging or as part of a debugging procedure. Researchers define the debugging is an activity of localization, understating, and correcting faults. Therefore, to debug a code, one has to first localize the fault. In a large software project with millions lines of code and source files, it would be very hard or even impossible to check them all. Knowing the fault, one has to first narrow down her search for fixing a fault. Modular programming helps us in this matter, because we can easily review a limited number of modules related to the fault. Lack of understating the root of the fault can end up a fix only correcting the symptoms, yet not the actual problem. Therefore, once one localized parts of a code involving a fault, next she should figure out an actual reason. The fixing is the last step of debugging procedure, and there has to be ensured the issue is mitigated and no new issue appears.
Testing
Debugging is started once a fault is revealed. One way for revealing and modelling faults is software testing. A test-case is a pair of input and output of a software. If what she gets as an output differs from her expectation, a fault was occurred. A test-case, as a scenario of an execution, can be functional or non-functional.
Functional test-cases check whether the output is expected for the user. For example, a program computing square root is expected to return 2 when 4 is inputted. Non-functional test-cases examine the quality of a given software system. Unlike many non-functional properties, Performance is an important non-functional property that could be straightforwardly tested. Measuring the elapsed time, the number of finishing tasks in a unit of time, and the number of concurrent clients are some candidates for test performance in any software systems. Real-time systems have a strict restriction on time performance: a particular number of tasks have to be done a certain amount of time.
Also, A Test-case has to be reproducible. A failed test-cases, as a specification of a fault, has to always make the same output no matter how many times it executed. Making reproducible test-cases for concurrent software systems could be very hard and might be impossible. So, one may need to simulate the same situation within a test-case.
Functional debugging
Given a test-case revealing a fault in functionality of a software, one has to first localize the debugging area and try to understand the potential reasons. Debugging a fault can be done using static or dynamic information. The static debugging is performed using the code without considering any execution traces. As an example, when one debugs a fault in a multiplication operator of a calculator program, she only works on the modules calculating the multiplication operator and the rest can be safely ignored. The complexity of using programming structures, such as loop or if statements, makes the static diagnosis really hard or impossible in some cases. Debugging, on other hand, can use dynamic traces of a program execution. Any test-case represents one execution trace of a given program, whereas the code execution the test-case may involve much more than one trace. Once a faulty trace is found, the localization and understating become focused and much easier.
There are couple of techniques to find the appropriate execution traces. Some may need to instrumenting the code and others use the debugging tools. Some techniques are useful for basic faults and others for more complex ones.
Tracing the code step-by-step. uVision Debugger, like many other modern debugger, provides facilities for executing the code line-by-line. After executing each statement, one may see the contents of stack, memory location, registers, variables, and ports and check how the statement affects on them. The single step tracing gives very detailed information, but becomes cumbersome or infeasible debugging for repetitive and long traces.
Breakpoints. Instead of stepping into every statement, one can use breakpoints to trap the execution on some particular lines. Once the program execution is stopped at a line, all the execution information becomes visible for checking or even changing. Breakpoints are very powerful debugging tool that are used to stop the execution on specific statement or specific condition. For example, one might set a conditional breakpoint to pause the execution if a variable is read or written in.
Instrumenting with printf. Using printf statements is probably the most dominant and effective debugging technique that is used by programmers(Valvano, J. (2014b)). For debugging a fault, a programmer instruments the code by placing printf statement in particular locations to see how variables are changed during a test-case execution. Clearly, debugging with printf statements only requires a compiler and does not need any debugging tool. The problem with using printf statements in realtime systems is that the print command may not be always available. Moreover, instrumenting the code with printf statements is not repetitive and some statements have to be changed from one test-case to another one.
Instrumenting with dumping in caching. One issue with previous techniques is time constraints unusually enforced in realtime systems. For example, in a realtime software system processing external events in a certain amount of time, stopping the execution or wasting clocks for printing could cause the event is lost because of another event arrival. In this situation, one can define an array, usually a large one, and dump the debugging data in it. When the trace is finished, the array can be printed or checked with memory window. This instrumenting technique puts a minimum overhead compared to printf.
Performance debugging
A Realtime system has to finish a task in a certain amount time, otherwise everything might fail although the system eventually carry out its functions. Performance debugging plays very important role in realtime systems and definitely is harder than functional debugging. Three popular techniques are used for performance debugging(Valvano, J. (2014b)):
Counting statements’ bus cycles. The code , in C or Assembly, is eventually transformed to machine instructions to be executed on a microcontroller. Every machine instruction is executed within certain number of clocks. So, collecting the number of clocks for all instructions of a program gives the execution time. Although this technique gives the most accurate elapsed time and does not make any overhead, but is just practical for small programs with no branches. Modern microcontrollers employ techniques, such as pipelines, Interrupts, and multitasking, to execute more tasks in less time.
Instrumenting the code with time counter. Cortex-M3 provides a timer helping operating system to carry out scheduling tasks in task-management. Systick (Yiu, J. (2010)) is a 24-bit down counter that is used to generate interrupts or timing measurement. The counter puts a minimum instrumentation overhead (Valvano, J. (2014b)).
Monitoring ports. This technique uses external monitoring and measurement tools, such as an oscilloscope, for performance debugging. In this technique, the output ports are monitored for any signal changes. The time between two signals is computed as an elapsed time. For example, one can instrument the code by putting two statements for turning on and off an L.E.D. before and after a code block, and monitor the L.E.D.’s GPIO port. The time that the L.E.D. stayed on is measured as the execution time of the code block. Compared to instrumenting with a time counter, this technique can measure time more that 24-bit clock. uVision provides Logic Analyzer to monitor the content of global and static variables. This feature is enabled in Simulation mode and target mode with ULINK Pro connection.
Debugging with Simulator
The code is in the svn repo: https://voa.svn.cloudforge.com/mte241/simulation_uart
Configuring Retarget.c
The retarget file is configurable to print on glcd and print on/scan from UART port. The UART client can be PUTTY that is already explained in the course page. If neither of these two cases are selected, retarget.c forwards the IO to the UART(printf) window provided in simulation mode.
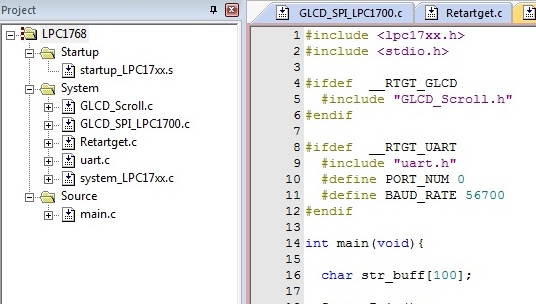
As mentioned, the retarget.c forwards the IO to GLCD, UART, or both. It means if you want to print on any of them, you have to include the related files. But since we want to test all cases, I have put all files in the same directory and included the c files in the project:
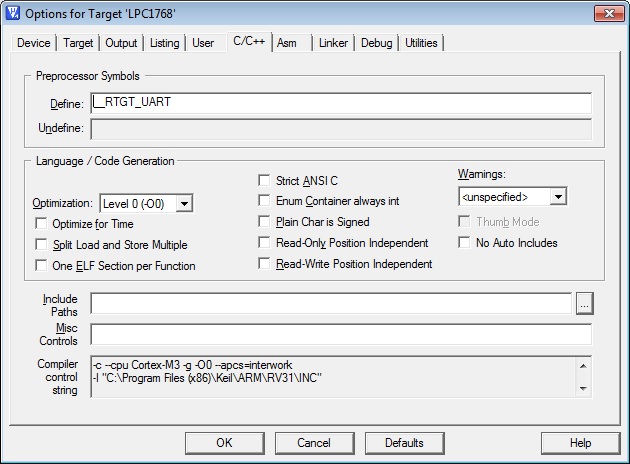
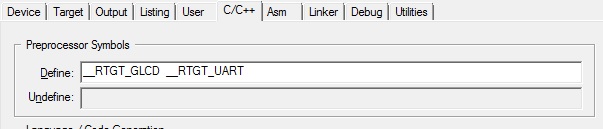
As you can see in the main.c, depends on two preprocessor commands, __RTGT_GLCD and __RTGT_UART, GLCD or UART are selected as input/output stream. Either options has their own initialization methods. For using external UART, not the simulated one, PORT_NUM and BAUD_RATE have to be set. The preprocessors can be passed to the compiler through C/C++ tab in target option window (Project->Options for Target ... ). As following figures show, if __RTGT_GLCD is defined, the IO will be GLCD, if __RTGT_UART is defined, the external uart is selected, if both are defined, then both will be output but uart is the only input. Two definitions are separated with space. Finally, if none of them is selected the simulator uart works.
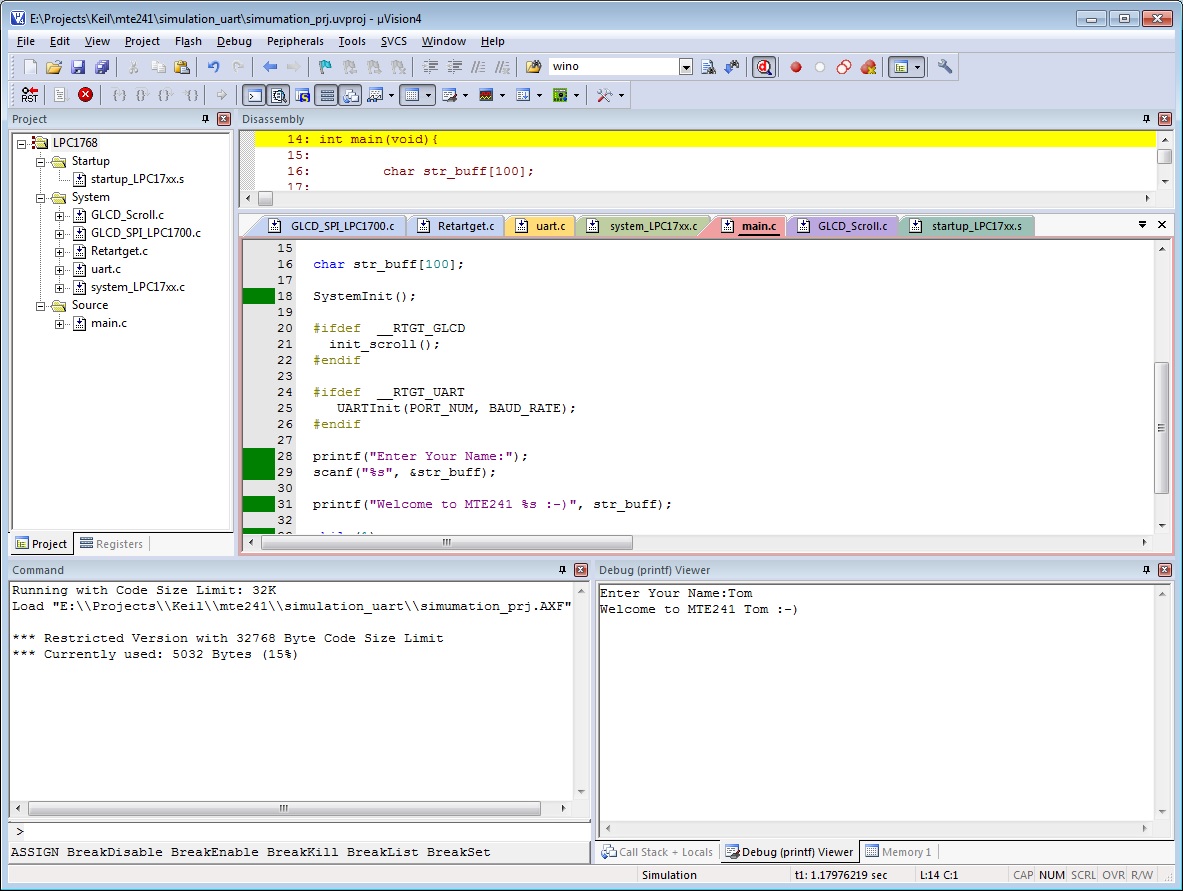
Using UART in simulator
If no definition is passed to the program, the simulator uart is automatically selected. To work with you have to first put the Debugger in Simulator mode. To do so, just go “Target Options”->Debug and select “Use Simulator” radio button. After compiling the sources code, just start a debugging session from Debug->”Start/Stop Debug Session” menu. Next, activate the uart(printf) menu from View->”Serial Windows”->”Debug(printf) Viewer” menu. Now by running the program from Debug->Run menu, you will see the output in the Debug(printf) Viewer window:
Now you can easily interact with the board through COM port.
Common Mistakes:
References
Valvano, J. (2014a). Embedded systems: Introduction to ARM Cortex-M microcontrollers. (5th ed.). S. l.: Jonathan W. Valvano.
Keil.com. (n.d.). Getting Started Creating Applications with μVision®4.
Valvano, J. (2014b). Embedded systems: Real-time operating systems for the ARM® cortex-M microcontrollers. (2nd ed., Vol. 3). Texas: Jonathan W. Valvano.
Yiu, J. (2010). Definitive guide to the ARM Cortex-M3. Amsterdam: Newnes.