μVision Integrated Development Environment
The μVision integrated development environment (μVision IDE) is an environment that allows you to code, build, load or simulate, and debug your projects on the Keil evaluation board. The environment has two states:
- Development
- Simulate and debug
Windows and tabs
The development environment allows you code and define projects, to build those projects, and to load the exeutables onto the Keil evaluation board. In order to facilitate this, the layout is broken into three windows:
- Status windows
- Source window
- Output windows
These are shown in Figure 1.
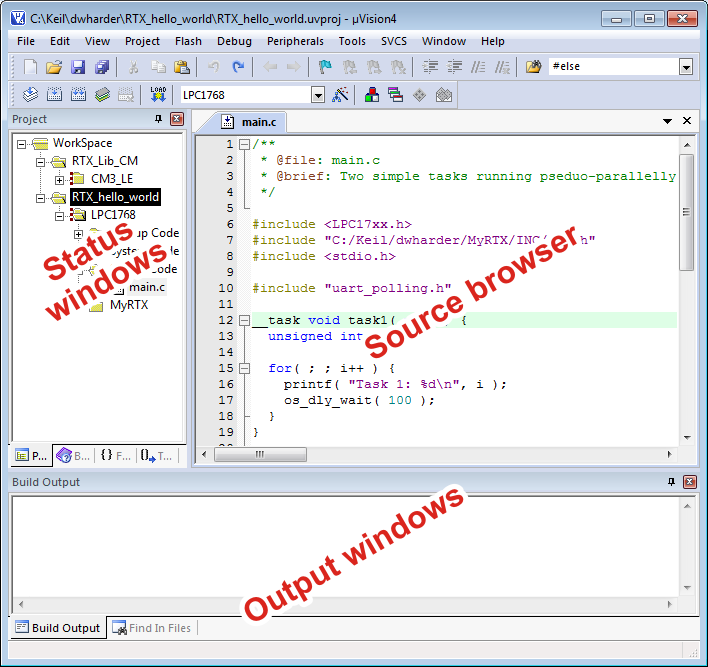
Figure 1. The layout of the μVision IDE.
The status and output windows can hold up to four tabbed panels each, where the tabs appear at the bottom of the window. These are shown in Figures 2 and 3, respectively.
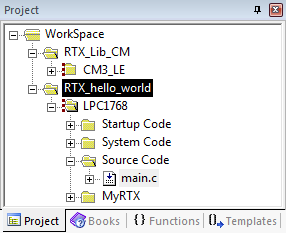
Figure 2. The four possible tabs within the status window.
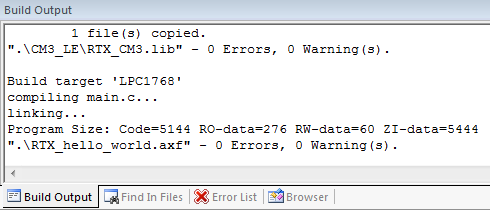
Figure 3. The two possible tabs within the outpu window.
The source editor, on the other hand, allows you to edit multiple source files simultaneously, each with a tab appearing at the top of the window, as shown in Figure 4.
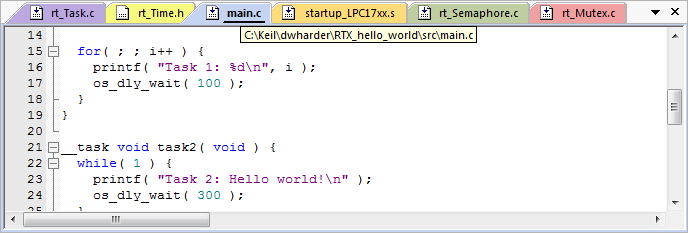
Figure 4. Editing multiple files in the source editor.
Certain files can be marked up so as to be edited not by changing the source code, but by using an interactive configuration window. One such file is RTX_Conf_CM.c, which allows the user to select the Configuration Wizard by selecting the appropriate tab at the bottom of the soruce file, as shown in Figure 5.
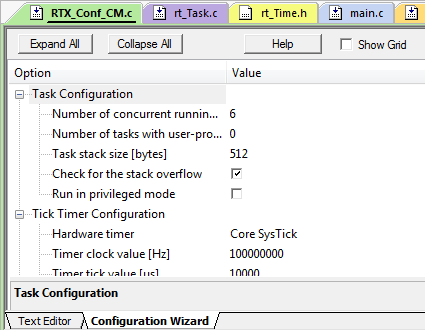
Figure 5. Selecting the Configuration Wizard tab for the RTX_Conf_CM.c source file.
Toolbars
There are three toolbars available:
- The File toolbar (always visible),
- The Build toolbar (visible only in development), and
- The Debug toolbar (visible only during simulating and debugging.
We will discuss the File toolbar here, but the other two will be discussed in the corresponding section.
The File toolbar sidplays the following:
- File and Edit
- New document (Ctrl-N)
- Open an existing document (Ctrl-O)
- Save the active document (Ctrl-S)
- Save all open documents and project settings
Development
The windows that are visible in development mode are the first four that can be selected under the
The Status Window
In development mode, the Status window has four tabs:
- The Project tab: a hierarchical structure of the project or projects
- The Book tab: a collection of references, most of which point to web pages, but some, such as the Tools Use's Guide which opens a new dialog.
- The Functions tab: a summary of all user-defined the functions in the project or projects.
- The Templates tab: list of templates you can use in code development.
These tabs may be closed by selecting the "x" in the top right corner or by selecting or unselecting the window from the View menu, shown in Figure 2.
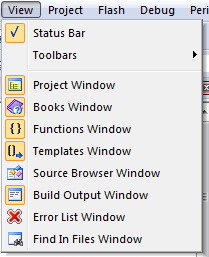
Figure 2. The view menu with a list of tabs available in the Status (first four) and Output (last four) windows.
The source editor
As mentioned above, the source browser allows you to edit numerous files and if a file is configured appropriately, it can also edited through a Configuration Wizard.
The output window
The Output window also has four tabs:
- The Build Output tab: the output of any build or compilation.
- The Source Browser tab: allows you to search source files for function names, macros, types, variables, etc.
- The Error List tab: a list of errors in compilation providing a cleaner interface than just by reading the output of the compiler.
- The Find in Files tab: displays the output for finds performed across multiple files (Edit→Find in Files... or Ctrl-Shift-F).
Simulating and Debug
To be completed...

Department of Electrical and Computer Engineering
University of Waterloo
200 University Avenue West
Waterloo, Ontario, Canada N2L 3G1
Website maintained by Douglas Wilhelm Harder