- ECE Home
- Undergraduate Studies
- My Home
- Presentations
- Guidelines

To compare the three image formats JPEG, PNG, and GIF for storing photographs, we will use the image shown in Figure 1: the Convento de Cristo in Tomar, Portugal. This photograph was taken by the author. The cylindrical Romanesque structure to the right was of Templar construction dating from the late 12th century and the Gothic extension was added in the early 16th century under King Manuel I.
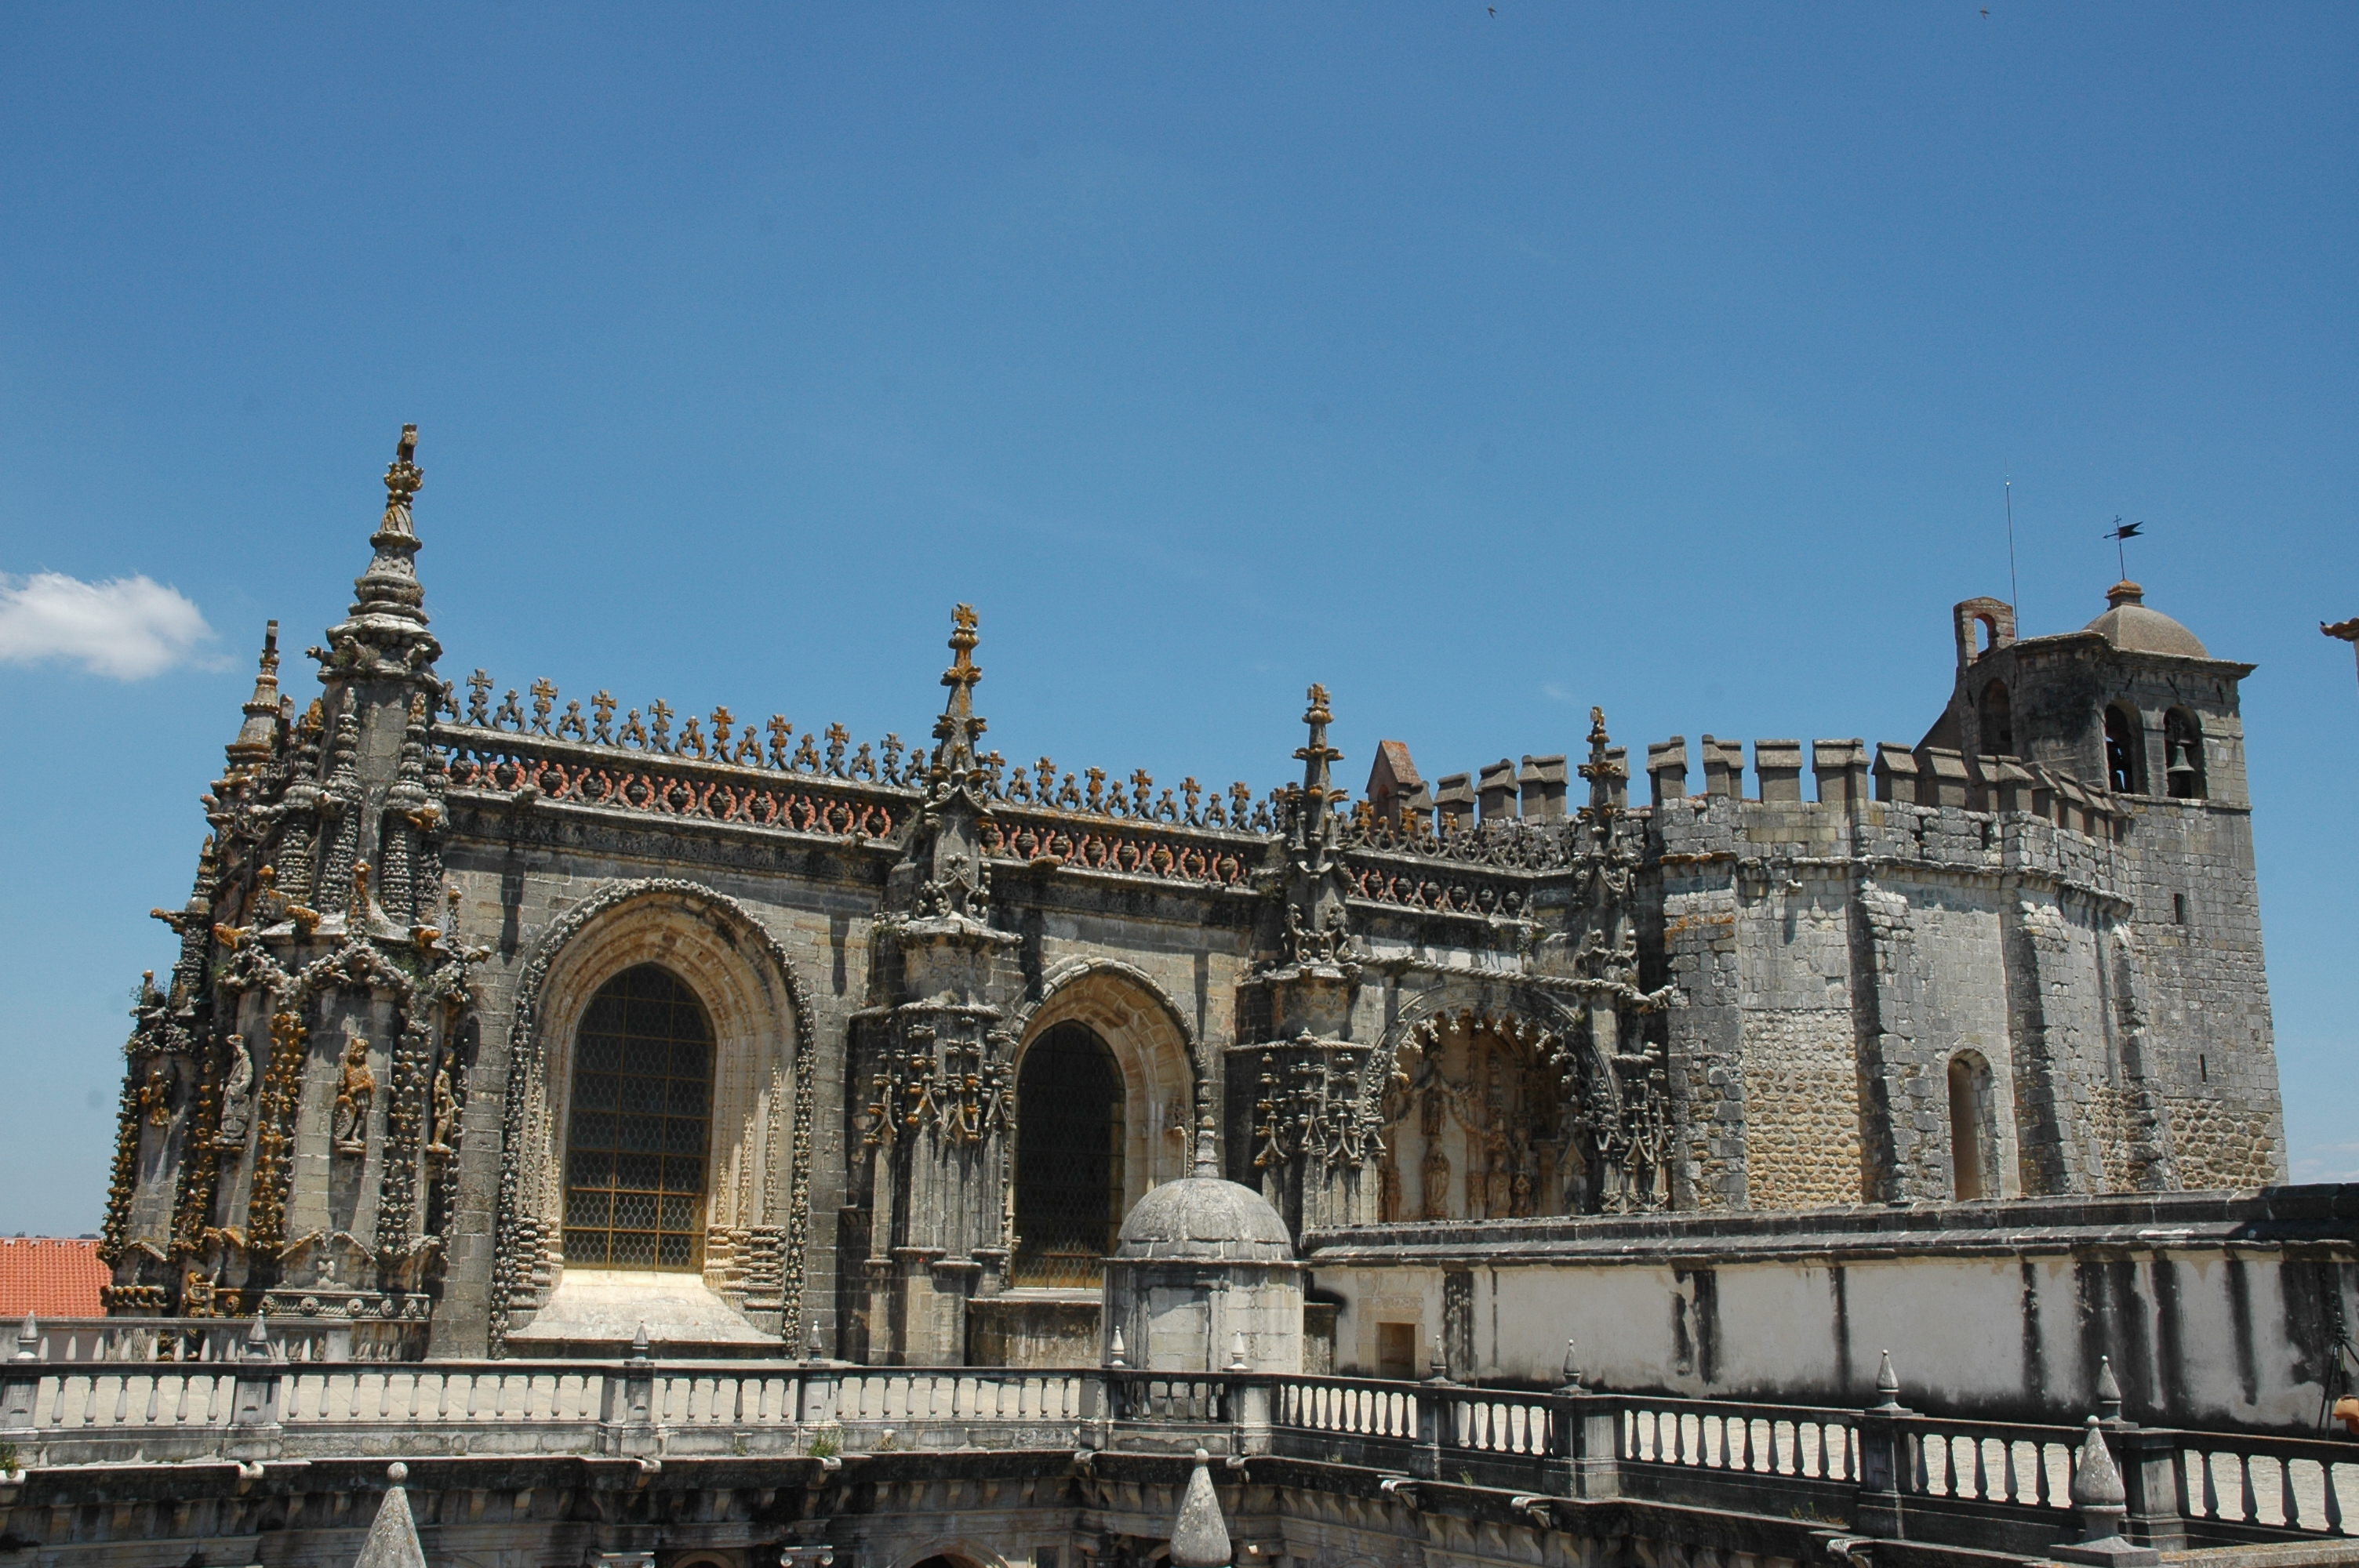
Figure 1. A 542×360 photograph of Convento de Cristo in Tomar, Portugal (click to enlarge).
Table 1 lists the file sizes of the various formats including the quality factor. The compression ratio of the GIF is given in relation to an uncompressed 8-bit image while the others are given in relation to an uncompressed 24-bit image.
Table 1. File sizes.
| Format | Compression Quality |
File Size (bytes) |
Relative Image Size |
|---|---|---|---|
| Raw (24-bit) | — | 780480 | 100% |
| Raw (8-bit) | — | 195120 | 100% |
| PNG | — | 414197 | 53.1% |
| GIF | — | 55637 | 81.2% |
| JPEG | 100 | 158495 | 20.3% |
| 75 | 36680 | 4.70% | |
| 50 | 24588 | 3.15% | |
| 25 | 15719 | 2.01% | |
| 0 | 3304 | 0.423% |
Figures 2 through 8 show the image shown in Figure 1 in each of the above formats. Figure 2 shows the original PNG which is included for comparison.

Figure 2. PNG storage.
Figure 3 uses the GIF to store the image. What is immediately apparent is the speckled texture of the sky. This is the result of an effect termed dithering which attempts to compensate for having only 256 colours.
Figure 3. GIF storage.
It is exceptionally difficult to differentiate the JPEG in Figure 4 with the lossless PNG in Figure 2 even though the JPEG is only 40% the size of the PNG.
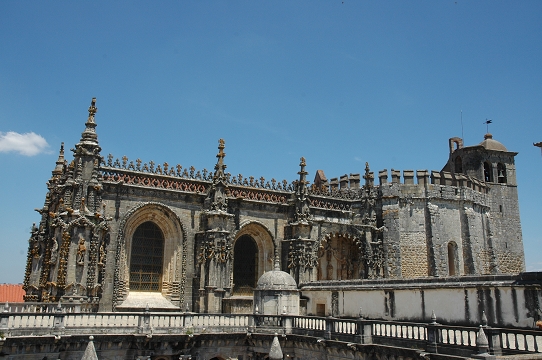
Figure 4. JPEG with a quality factor of 100.
Without zooming into the image, it is difficult to differentiate Figure 4 at 100 quality and Figure 5 which is only 75 quality, even though Figure 5 is roughly 25% the file size of Figure 4. Looking closer, however, will show artifacts appearing around the clouds, the battlements, and the weather vane.

Figure 5. JPEG with a quality factor of 75.
A quality factor of 50 shown in Figure 6 reduces the file size 33% less than Figure 5; however, the the decorative battlements appears to be fuzzy.

Figure 6. JPEG with a quality factor of 50.
With the quality factor of 25 shown in Figure 7, the stones and bricks in the walls are becoming less distinct and the sky appears to be layered.
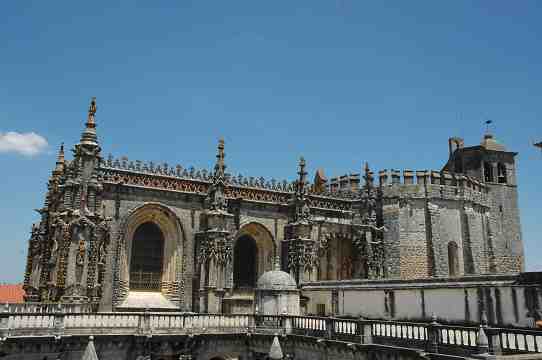
Figure 7. JPEG with a quality factor of 25.
Finally, Figure 8 demonstrates the result of a compression ratio of 236:1. On average, only one byte of information is stored for each 8×8 block of 24-bit pixels and yet the image is still recognizable. More surprising, however, is that Figures 7 and 8 appear to be virtually indistinguishable when viewed from five metres away.
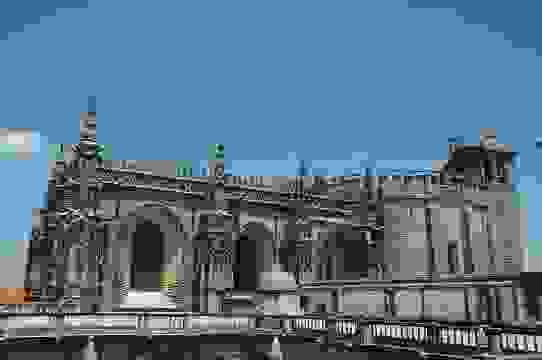
Figure 8. JPEG with a quality factor of 0.
To understand the difference between the various formats, it is more useful to zoom in on a certain portion of the image. To demonstrate these differences, we will zoom in on the left buttress. The astute reader may note that all images are saved as PNG. This is to ensure that the factor-of-eight zoom is correctly preserved.
Figure 9 shows a zoom of the original image. Each individual pixel appears as a square.
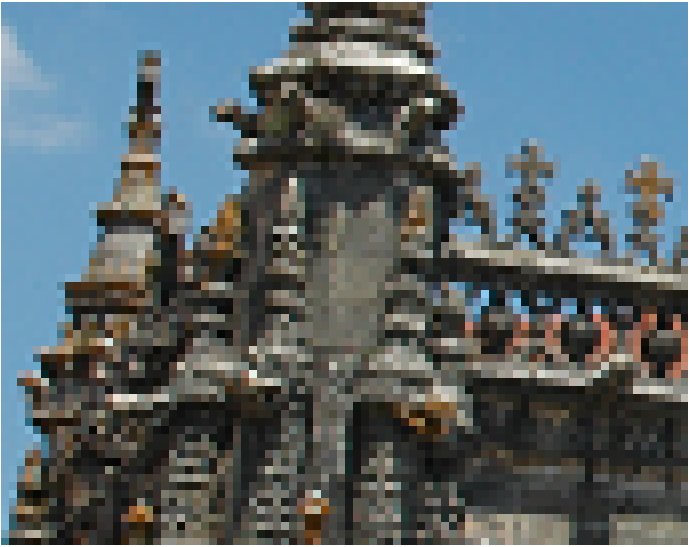
Figure 9. A zoom of the PNG storage.
Figure 10 clearly shows the dithering result of GIF, however, note that the colours are still vibrant.
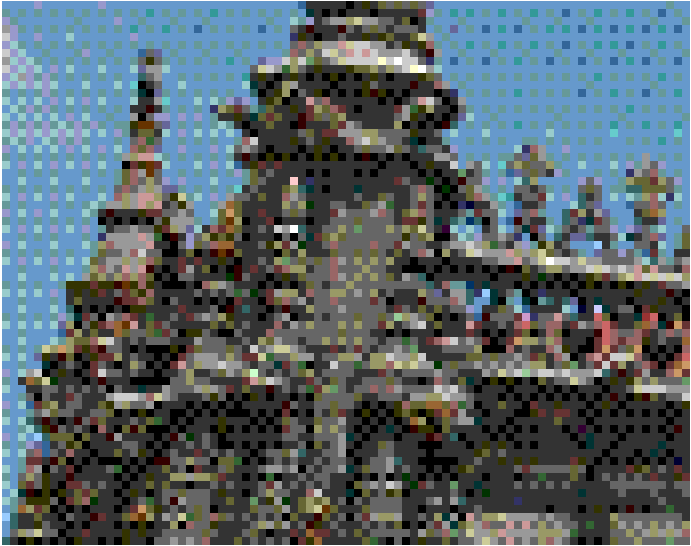
Figure 10. A zoom of the GIF storage.
Figure 11 shows a zoom of the JPEG with a quality factor of 100. At this point, it is possible to see the one significant difference between the original PNG and the JPEG: the red ornamentation on the battlements at the right of the images is less vibrant. This is because JPEG converts the RGB colour space into YCbCr where most information is used to store the luminance (Y) and less information is used to store the red and blue chrominance (Cr and Cb, respectively).

Figure 11. A zoom of the JPEG with a quality factor of 100.
The zoom on a JPEG with a quality factor of 75 shown in Figure 12 clearly shows distortion around most of the detail.
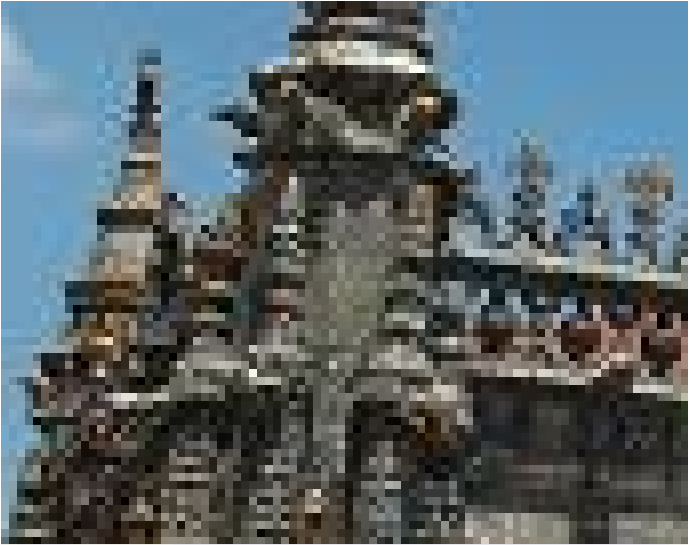
Figure 12. A zoom of the JPEG with a quality factor of 75.
With a quality factor of 50, it is possible to see in Figure 13 the 8×8 blocks which JPEG uses in its compression algorithm.
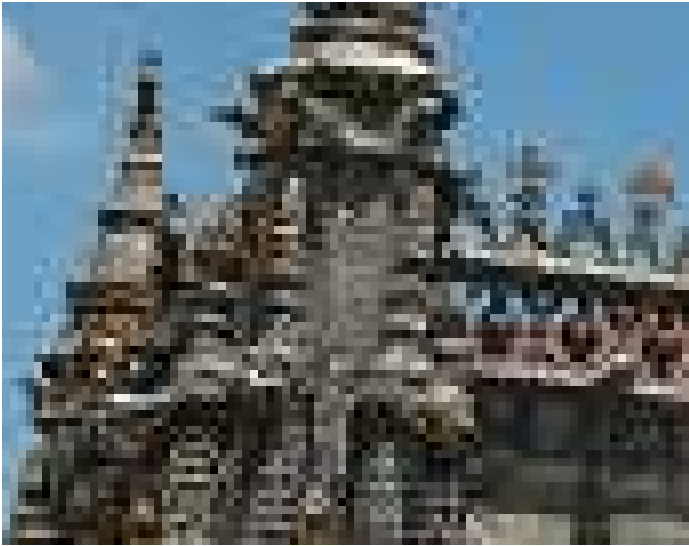
Figure 13. A zoom of the JPEG with a quality factor of 50.
Figure 14 is unrecognizable; however, step three metres back and Figures 13 and 14 are, as before, virtually indistinguishable.
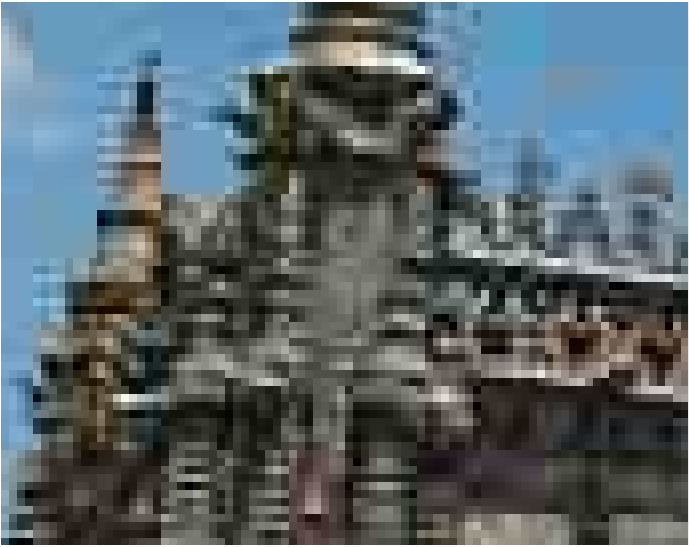
Figure 14. A zoom of the JPEG with a quality factor of 25.
Finally, in Figure 15, the 8×8 blocks are clear. In many cases, all frequency has been removed from the blocks leaving a monochrome square. In all cases, it is even possible to determine, by observation, which of the Fourier coefficients were not zeroed out.
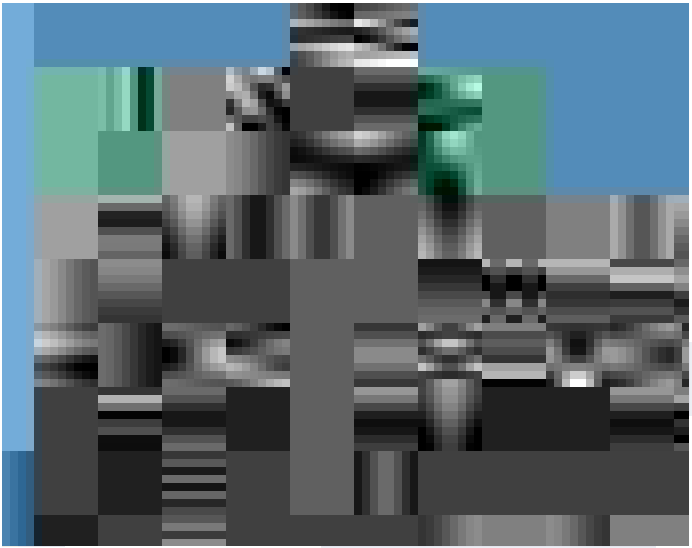
Figure 15. A zoom of the JPEG with a quality factor of 0.