Figure 2: Compiling and debugging the example in Section 1.1.

GDB The GDB only works with binary files compiled by ‘g++’ with ‘-g’ compiler option. Using this option, the compiler generates more information used by GDB to debug the code. For example, Figure 2 shows how the example in Section 1.1 can be compiled into a binary file called ‘stack’ for debugging.
One can launch GDB by ‘gdb’ command and pass the binary file name that has been compiled with ‘-g’ compiler option. Figure 2 shows an example.
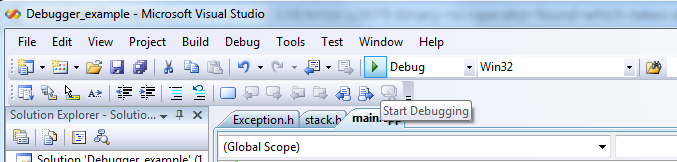
Visual Studio The debugger for a project in Visual studio is simply launched by just hitting on the ‘run’ icon on the debug mode in the toolbar or pressing ‘F5’. If the solution has not built so far, debugger asks to build the solution first. Figure 3 shows how this icon looks like.
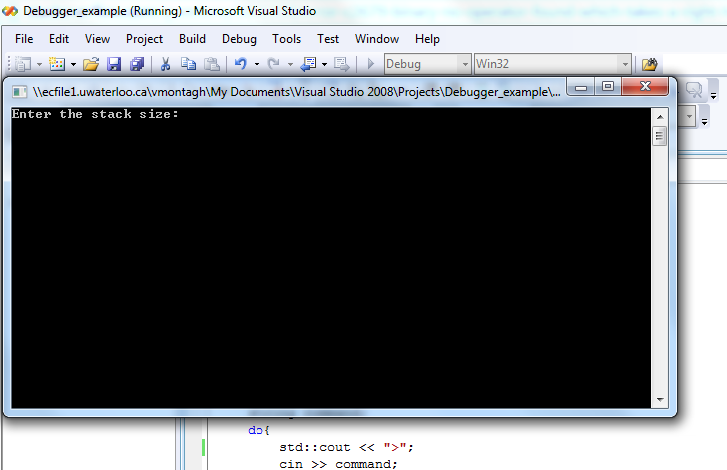
To debug the example expressed in Section 1.1, you have to first make an appropriate project for the given source codes. After building the solution, running the debugger executes the application and you see a console like in Figure 4.