2.2 Breakpoints and the ‘run’, ‘break’, ‘cont’ commands
Breakpoints are basic components of any modern debugger. Using breakpoints one
can pause a program execution at any executable program statement to investigate
the program state. For example, one can monitor what a variable contains during the
execution. The debugger shows some errors if breakpoints are set to a non-executable
statement such as comment lines.
Breakpoints in GDB
-
1.
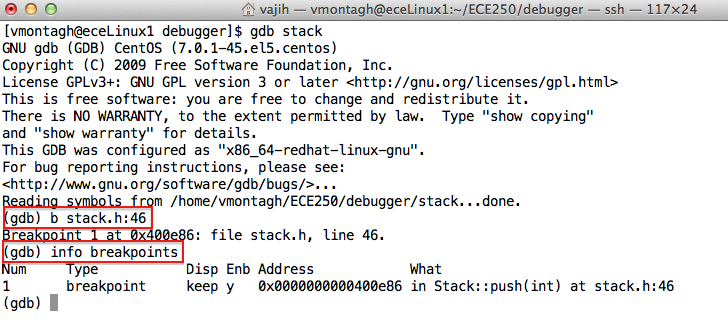
- In GDB, one can set a breakpoint using break command, ‘break’ or ‘b’.
For example, if we are going to see what value is pushed into the stack, we
can set a breakpoint at line 46 of ‘stack.h’ using ‘b stack.h:46’. Figure
5 shows the result of the breakpoint insertion command. Also, we can
see a list of all breakpoints and their current situation. Removing the
breakpoints can be done by ‘delete’ or ‘d’ command. It should be noted
that once a debugger paused at a statement, that statement has not been
executed and the variables have not be changed yet.
-
2.
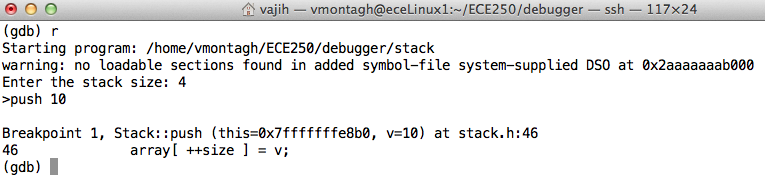
- Now, one can launch the program using ‘run’ or ‘r’ command. The
program execution is normally continued until a breakpoint is met; the
debugger then waits for the next command. Continuing the example,
GDB pauses after pushing an integer in the stack and waits for the next
command (Figure 6). The debugger shows the line where it paused before.
-
3.
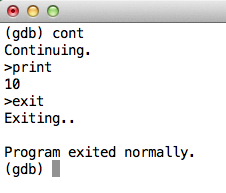
- After the program is paused at a breakpoint, one can either continue
the execution using ‘cont’ command or play with the variables. By
entering continue command the program execution is resumed until a next
breakpoint is met. Figure 7 shows the result of ‘cont’ command in the
example.
Breakpoints in Visual Studio
-
1.
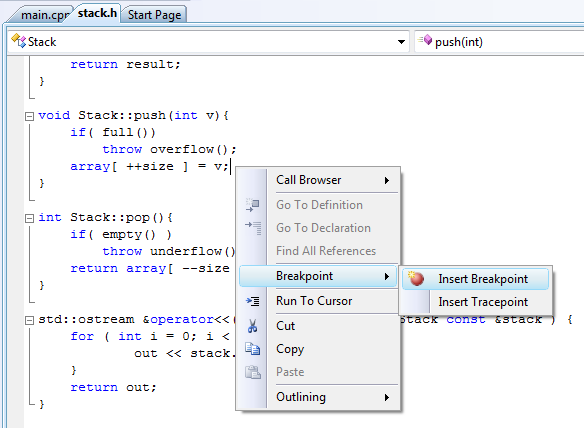
- In Visual Studio, one can set a breakpoint by just right clicking on an
executable statement, and ‘Insert Breakpoint’ from Breakpoint menu.
Back to the Stack class, we can put insert a break point at line 45 before
the value of argument is written in the array (Figure 8).
-
2.
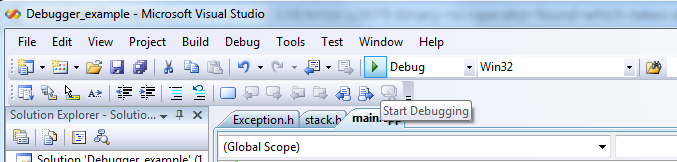
- After insert a breakpoint, the program has to be run by hitting on the
debug icon on the tool-bar (Figure 9).
-
3.
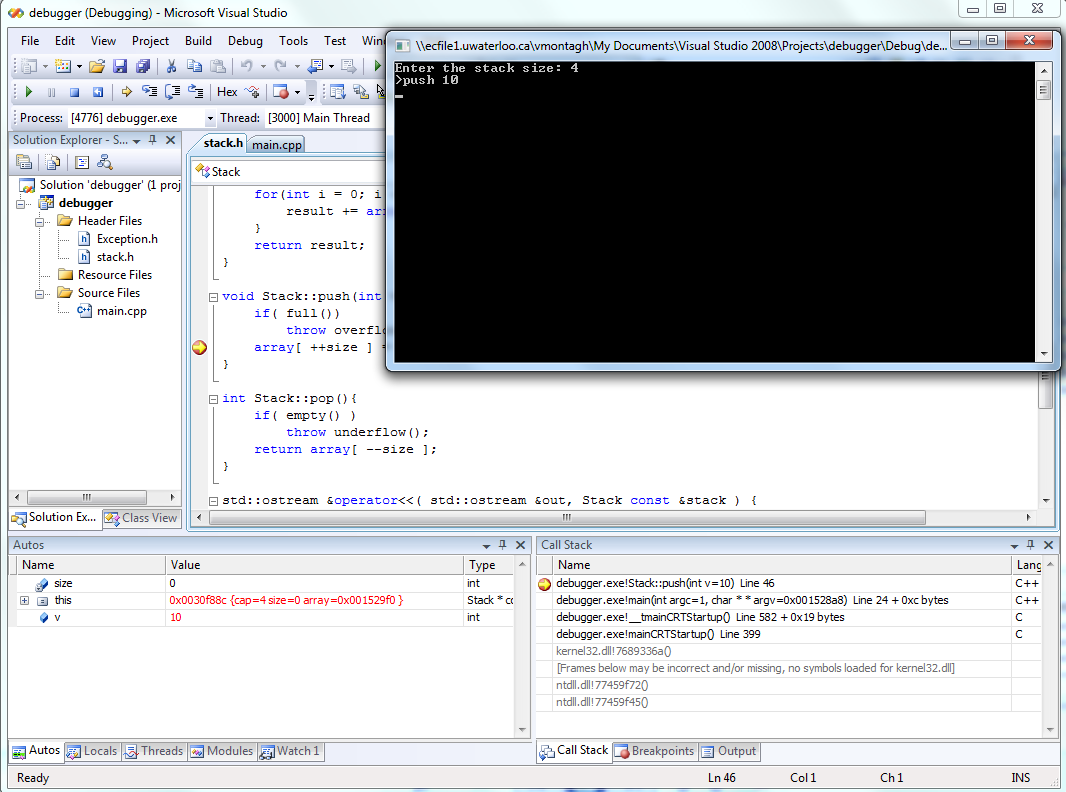
- After starting the debugger, the program runs like a normal execution
until a breakpoint is reached. For example, if we try to push an item into
the stack, the breakpoint in the push function is triggered (Figure 10).
Once a program execution is paused on a breakpoint, all live variables can
be seen in ‘Autos’ window.
-
4.
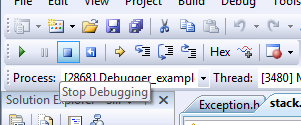
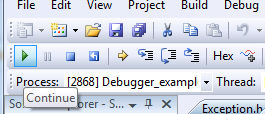
- The debugging from breakpoint can be either continued or stopped. Figures 11
and 12 respectively show the icons to resume or stop the current debugger
session.