- ECE Home
- Undergraduate Studies
- Douglas Wilhelm Harder
- Algorithms and Data Structures Home
- Example Algorithms and Data Structures
- Sorting Algorithms
- Searching Algorithms
- Iterators
- Trees
- General Trees
- 2-3 Trees
- Skip Lists
- d-ary Heaps
- Bi-parental Heaps
- Array Resizing
- Sparse Matrices
- Disjoint Sets
- Maze Generation
- N Puzzles using A* Searches
- Project Scheduling
- The Fast Fourier Transform
- String distances
- Matrix-chain Multiplications
- Inverse Square Root
- Newton Polynomials
- Random Trees
- Normal Distributions
- Splay Trees
- Leftist Heaps
- Skew Heaps
- Binomial Heaps
Comparison of d-ary Heaps
This has implementation of three d-ary heaps: binary, ternary and quaternary heaps. The style of the implementation is similar to focus on the run times of the different algorithms.
We will look at two different results: the average case and worst case scenarios normalized for the binary heap case being 100 %:
| Average Case | Worst Case | |
| Binary heap | 100 | 100 |
| Ternary heap | 91.4 | 79.4 |
| Quaternary heap | 98.4 | 70.1 |
| Quinary heap | 104.6 | 70.2 |
As can be seen by the plots in Figures 1 and 2, the average-case times follows the formula
while the worst-case times follow the formula
. Therefore, while some sites recommend
a quaternary tree as being optimal, it appears that a ternary tree is in fact better.
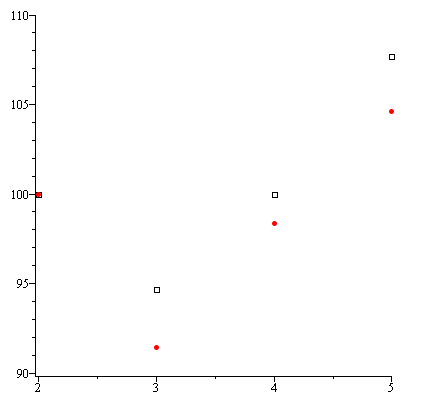
Figure 1. The run times for the average-case scenario using binary, ternary, quaternary, and quinary heaps (normalized to 100% for binary heaps with actual times in red circles and theoretical times in black squares).
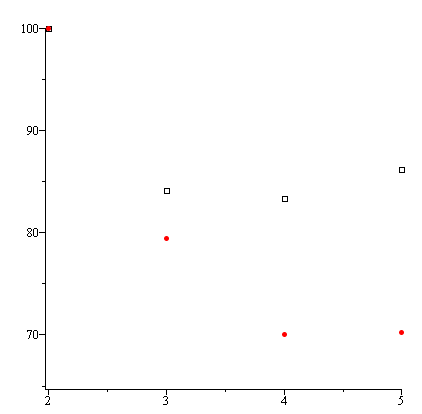
Figure 2. The run times for the worst-case scenario using binary, ternary, quaternary, and quinary heaps (normalized to 100% for binary heaps with actual times in red circles and theoretical times in black squares).
You will note that the theoretical times are much worse than the actual times. This likely has to do with CPU caching: pages of main memory that have been accessed recently remain in the cache and new pages result in cache misses that require access to main memory. With fewer memory accesses with higher-order heaps, it is more likely that there will be fewer memory accesses and therefore a corresponding higher probability that a particular page of main memory is still located in the cache.

Algorithms and Data Structures
Department of Electrical and Computer Engineering
University of Waterloo
200 University Avenue West
Waterloo, Ontario, Canada N2L 3G1
Department of Electrical and Computer Engineering
University of Waterloo
200 University Avenue West
Waterloo, Ontario, Canada N2L 3G1
Website maintained by Douglas Wilhelm Harder